Portfolio Dashboard User Guide
💡 All data, performance metrics, and strategy results shown are examples and for informational purposes only. Past performance is not indicative of future results. Investing and trading involve risk, including the potential loss of principal. Use of AI-based tools does not guarantee success or profitability.
Written By Ehsaan XP
Last updated 7 months ago
📊 Dashboard User Guide
The new dashboard is designed to give you a complete overview of your portfolio, assists, and assets across multiple exchanges in one place. Below is a breakdown of each area and how to use it.
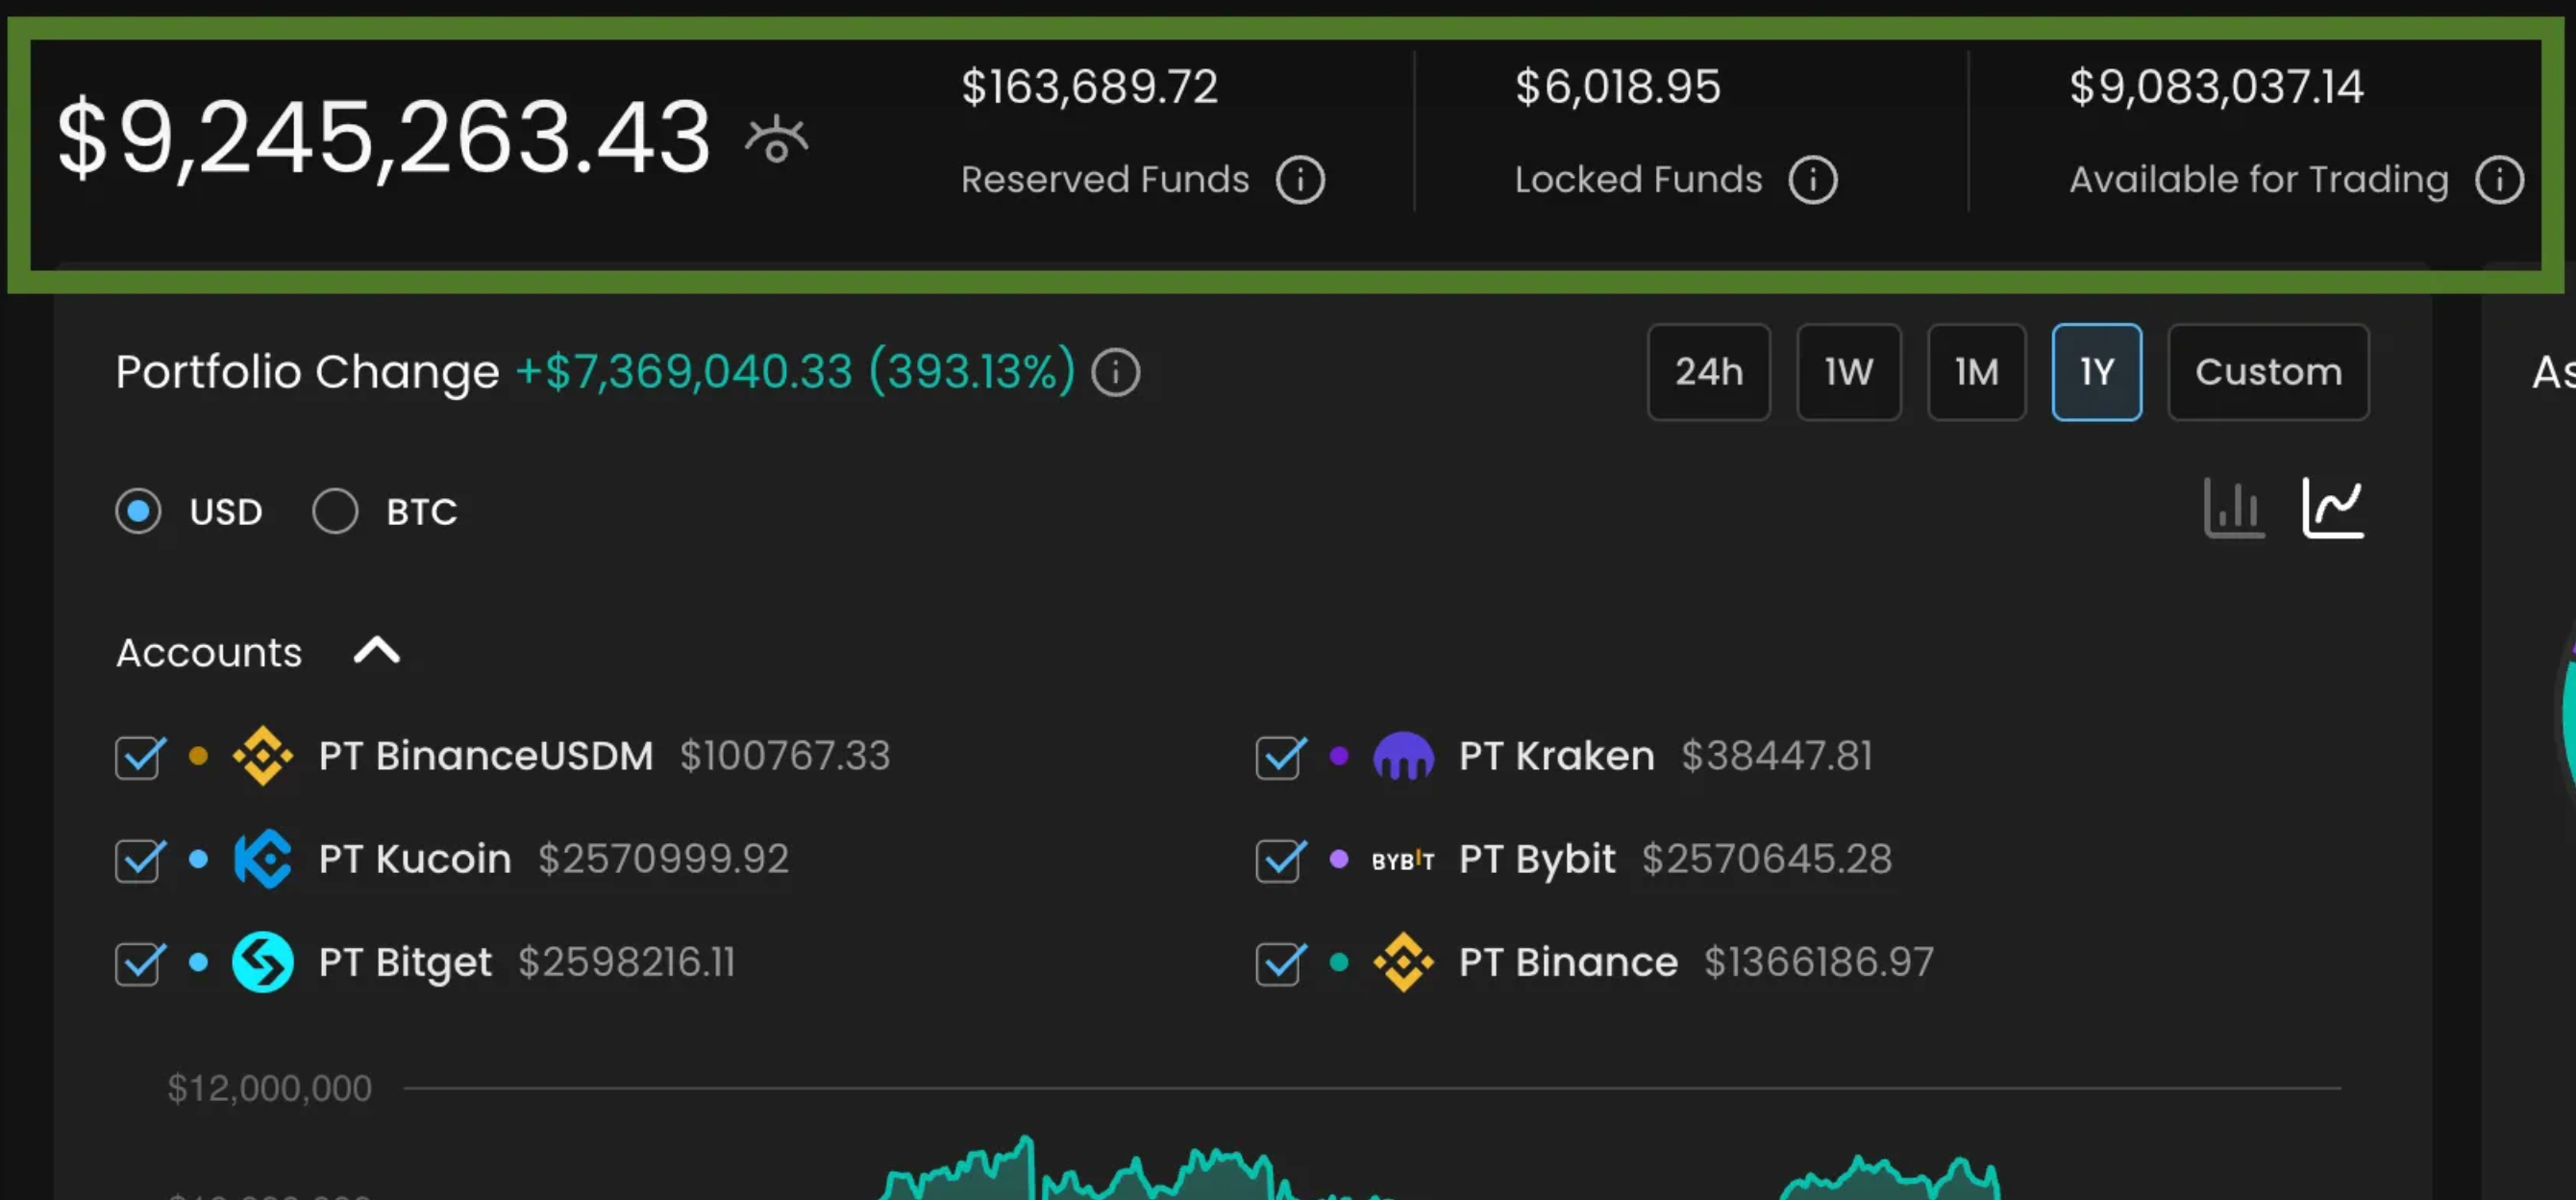
1. Portfolio Overview (Top Section)
Total Balance: Displays your total portfolio value across all connected exchanges.
Reserved Funds: Shows funds currently held for open orders.
Locked Funds: Displays funds currently held by system strategies or platform processes.
Available for Trading: Indicates liquid funds currently accessible for trading based on current data.
👉 Tip: Hover over any info icon (i) to see definitions for these fields.
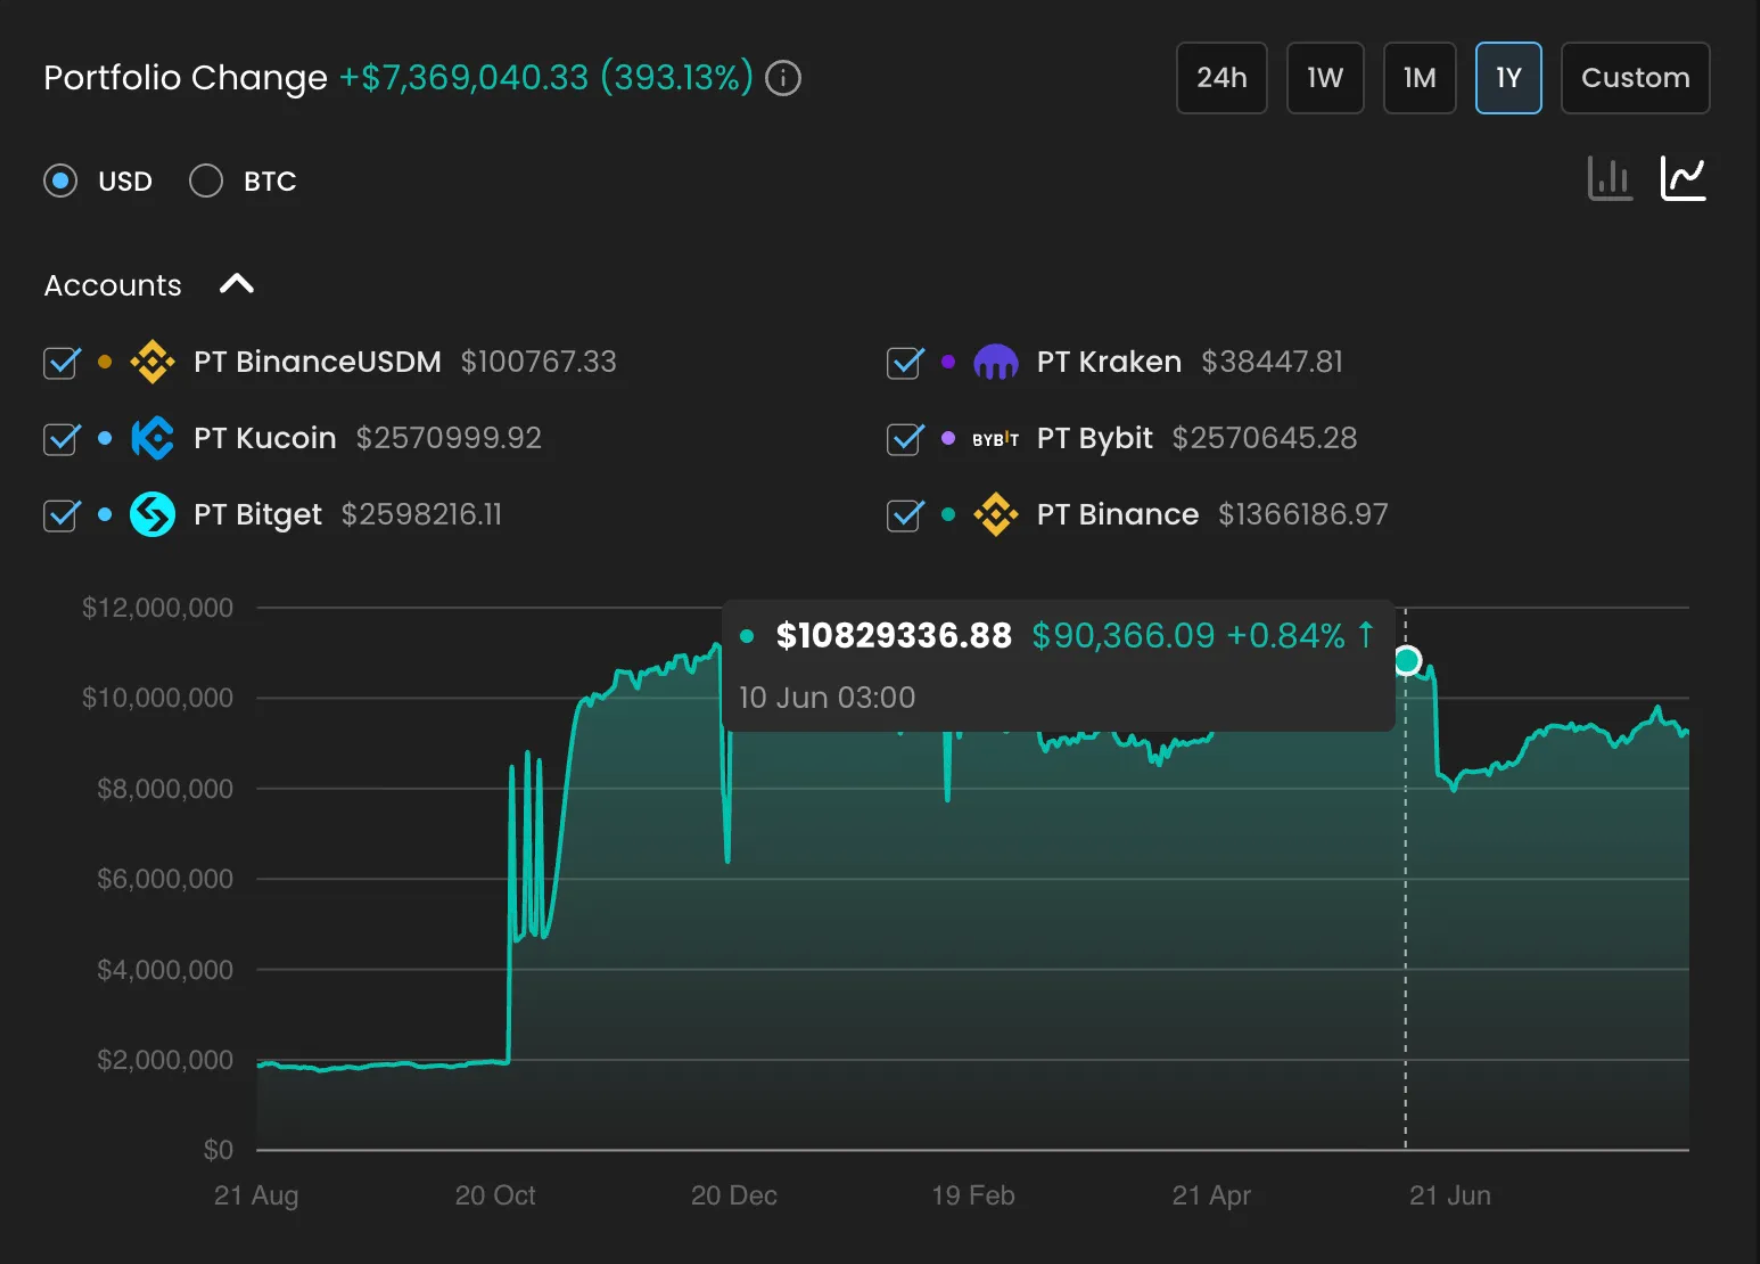
2. Portfolio Change & Performance
Change Tracker: Helps you understand how your portfolio has performed over time.
Time Filters: View performance over 24h, 1W, 1M, 1Y, or Custom periods.
Chart Types:
Bar Chart: Visualizes account movement by exchange.
Line Chart: Tracks portfolio value over time with detailed hover insights.
👉 Example: On 10 June, the portfolio value displayed was approximately $10.8M, reflecting a +0.84% change that day.
Note: This is sample data for illustrative purposes only.
3. Accounts Breakdown
Lists all connected accounts with their balances:
PT BinanceUSDM
PT Kucoin
PT Bitget
PT Kraken
PT Bybit
PT Binance (Spot)
✅ You can toggle accounts on/off to customize which balances are included in your totals and visualizations.

4. Asset Allocation
By Asset: Shows distribution of your portfolio in assets such as BTC, ETH, USDT, BONK, and others.
By Exchange: Switch to view allocation across exchanges.
Example: In the example shown, BTC accounts for approximately 48.22%, ETH 15.19%, and USDT 31.44%.
Figures shown are for illustrative purposes only and may not reflect actual performance.

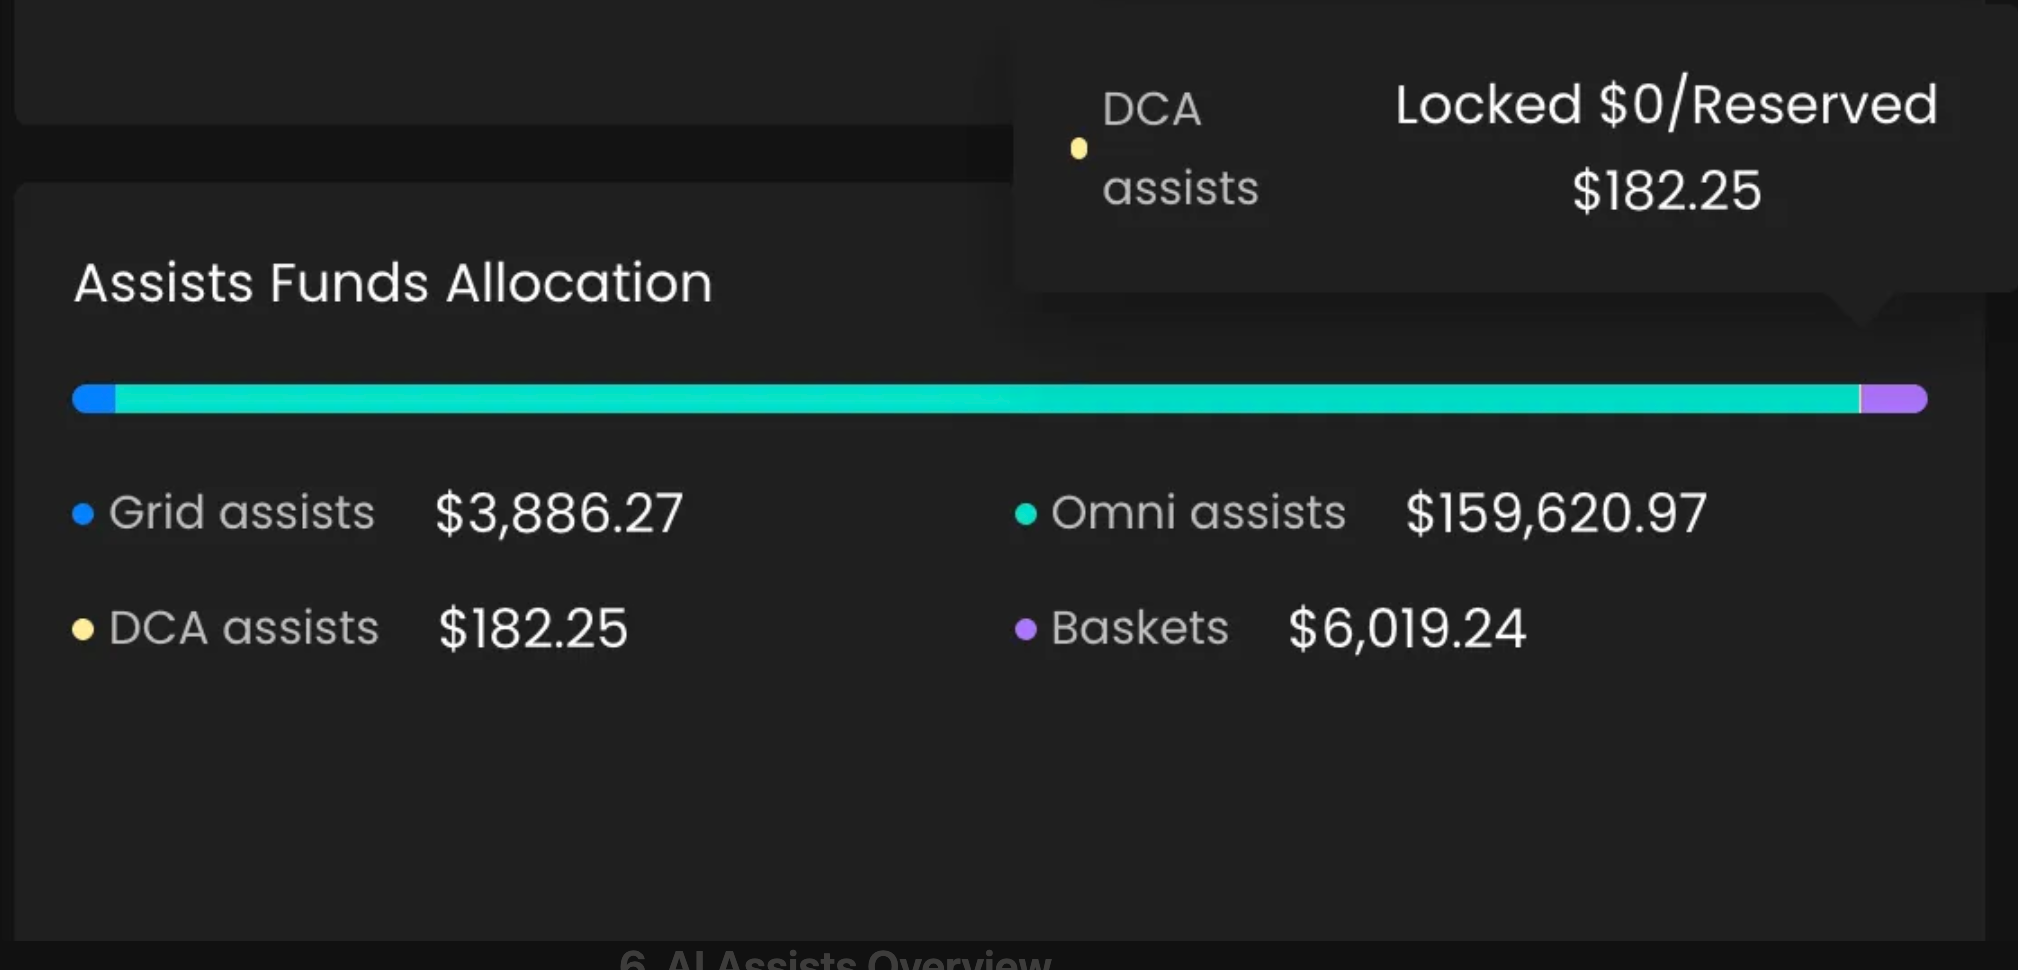
5. Assists Funds Allocation
Displays how funds are distributed across your AI-assisted strategies:
Grid Assists
DCA Assists
Omni Assists
AI Baskets
👉 Example: DCA assists currently hold the largest allocation in the sample data at ~$182.25.
These are example values and do not reflect expected results.
6. AI Assists Overview
At the bottom of the dashboard, you’ll find summary stats for each assist type:
AI Baskets
Active limit: 5/100
Sample Lifetime Profit: $1,022.94
Sample Daily Profit: $1,196.01
AI GRID Assists
Active limit: 1/∞
Sample Lifetime Profit: $104,647.41
AI Omni Assists
Active limit: 8/100
Sample Lifetime Profit: $1,708.29
AI DCA Assists
Active limit: 13/50
Sample Lifetime Profit: $1,787.34
👉 You can create new assists directly from this section.
🛈 These figures are provided for example purposes only and do not guarantee performance. Actual results will vary.

7. Assets Section
This section shows a detailed breakdown of your holdings.
Filters:
Choose between USD or BTC view.
Filter by exchange.
Option to hide small balances.
Asset Table includes:
Token (BTC, ETH, USDT, BONK, etc.)
Amount currently available
Price & 24h change (as provided by market feeds)
Asset percentage of your portfolio
Total value (approximate)
Quick Trade button for supported assets
👉 Example: In the sample shown, BTC value is approximately $4.46M, accounting for 48.22% of the sample portfolio.
Actual values will vary depending on your holdings and market data.

8. Community & Help
Community Button: Connect with other traders to share tips and strategies.
Guide & Help Icons: Access help documentation or quick tips.
Refresh Icon: Sync your latest balances and trades instantly.
✅ Key Takeaways
The top bar gives you a real-time snapshot of your portfolio status.
The middle section provides insight into performance, allocation, and AI strategy usage.
The bottom section helps you monitor and manage individual assets and AI assists.
You can initiate trades from the Assets section for supported pairs, subject to exchange availability and connection status.
The dashboard is interactive, with filters, toggles, and quick-create options.
Disclaimer: Trading involves significant financial risk and can result in substantial losses. Past performance does not guarantee future results. SageMaster does not provide financial advice. Users should ensure compliance with local regulations.