Technical Indicators
The SGM Bands Indicator is a sophisticated technical analysis tool developed by SageMaster to help traders identify optimal entry and exit points for grid trading strategies. This proprietary indicator combines advanced algorithmic analysis to create dynamic levels that serve as guideposts for market behavior, enabling traders to make more informed decisions in various market conditions.
Written By Ehsaan XP
Last updated 7 months ago
How the SGM Bands Indicator Works
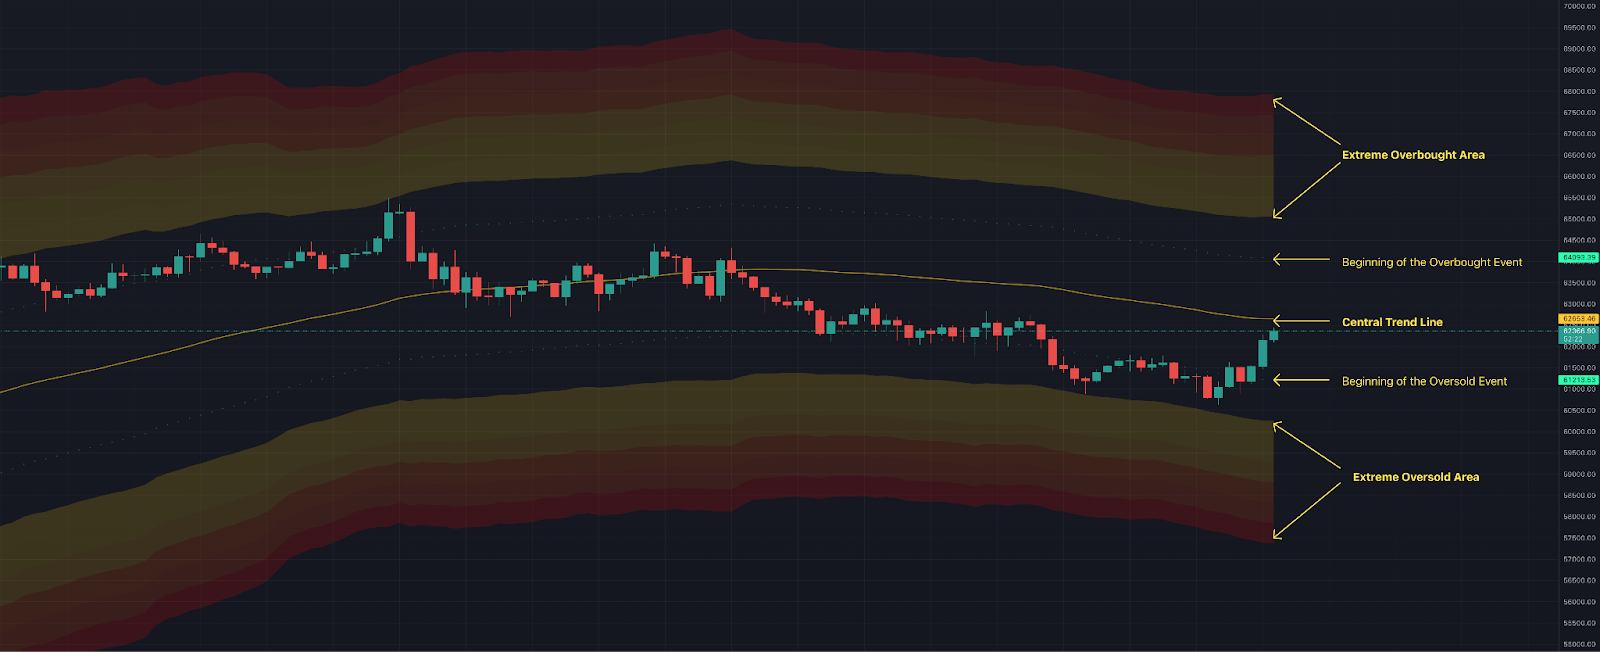
The SGM Bands Indicator creates a visual representation of market conditions through several key components:
Central Trend Line
Derived using long-term smoothing mechanisms to filter out market noise
Provides a clear view of the underlying market trend
Serves as the foundation from which other dynamic levels are calculated
Dynamic Levels
The indicator creates several key zones extending from the Central Trend Line:
Beginning of Overbought Event: The first level above the Central Trend Line, signaling when the market is starting to enter a potentially overbought state
Beginning of Oversold Event: The first level below the Central Trend Line, marking the potential start of an oversold condition
Extreme Overbought Area: Highlighted when price moves significantly above the Central Trend Line, reaching levels that historically correlate with the top extremes of market behavior
Extreme Oversold Area: Marked when prices drop well below the Central Trend Line into zones that have previously indicated the lowest extremes
Strategic Applications for Grid Trading
Opening Grid Positions
Optimal Entry Points: Initiate bullish grid strategies when price shows a rebound from the Extreme Oversold Area
Risk Minimization: Enter the market at positions that have historically proven advantageous, reducing the risk of opening positions at unfavorable price levels
Managing Active Grids
Dynamic Adjustments: Use the calculated levels to adjust your grid parameters in real-time
Volatility Response: Adapt to sudden market movements or unexpected volatility by referencing the indicator's visual guidance
Closing Grid Positions
Exit Strategy Optimization: Consider closing or adjusting your grids when price reaches a stabilizing point or shows reversal signals
Profit Taking: Use extreme overbought conditions as potential signals to take profits or reduce exposure
More info - SGM Bands Indicator
Best Practices to Avoid Opening Grids at the Wrong Time
Avoid High-Risk Conditions:
Be cautious about initiating new grids during highly volatile market phases
Pay attention to when price oscillates around the central trend line without a clear direction
Understand Risk Differentials:
Opening a position from the middle range (near Central Trend Line) carries higher risk of continued downtrend compared to entering from an oversold area
When in doubt, conduct further analysis to identify pairs with stronger potential for uptrend starting from oversold conditions
Timeframe Alignment:
Match your chart timeframe with your intended grid strategy duration
Short-term strategies work better with shorter timeframes
Longer-term approaches should use extended periods for more accurate trend assessment
QFL Ultra Guide
QFL Ultra is SageMaster.io's latest trading innovation that leverages the Quickfingersluc (QFL) method across 106 top cryptocurrencies. The service is designed to capitalize on market overreactions and panic sell-offs, providing traders with strategic entry points during volatile market conditions.
QFL Ultra enhances traditional QFL strategies through advanced algorithms that optimize entry points for cryptocurrency trading. The service features customized Dollar Cost Averaging (DCA) settings that reduce the need for multiple follow-up orders, creating a more streamlined and lower-risk trading process. By covering a broader range of assets and adapting to market dynamics, QFL Ultra offers traders a sophisticated approach to cryptocurrency trading.
Key Features
Optimized Entry Points: Enhanced algorithms identify ideal moments to enter trades, ensuring purchases below base level during panic selling
Customized DCA Settings: Fine-tuned settings reduce the need for multiple orders during market downturns
Broad Market Coverage: Focus on top 106 cryptocurrencies for diverse trading opportunities
Risk Management: Continuously updates strategy based on live market data for volatility resilience
Benefits
Comprehensive Strategy: Broad market coverage to capture growth opportunities across various assets
Enhanced Profitability: Optimized entries and DCA settings improve profitability in volatile conditions
Lowered Risk Exposure: Strategic entry points and fewer DCA orders reduce potential drawdowns
The service is available at: https://app.sagemaster.io/marketplace/provider/f5720cce-dd07-4ec4-a11d-0cf8a26825d1
More info - QFL Ultra
Integration with AI Settings 2.0
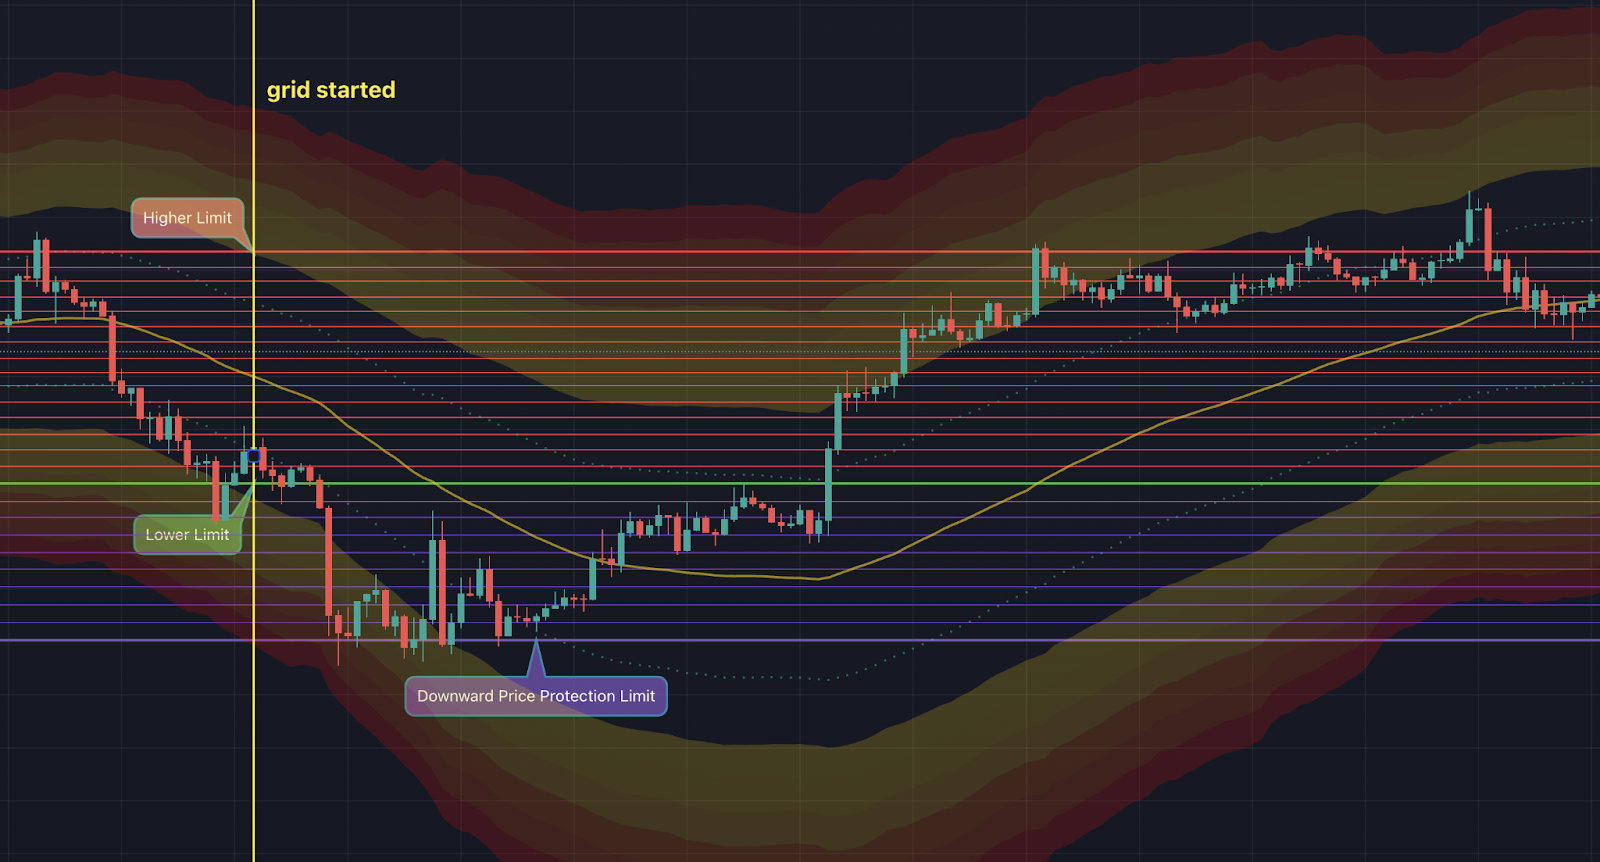
The SGM Bands Indicator works seamlessly with SageMaster's AI Settings 2.0 for grid trading, which provides:
Dynamic Grid Level Adjustment: Automatically calculates and sets 14 primary grid levels (7 above, 7 below) around a central baseline
Advanced Price Protection: Adapts to falling market conditions by extending the grid beyond initial setup
Trailing Mechanisms: Adjusts grid activation points as the market moves favorably to lock in profits
More info - AI Settings 2.0
Conclusion
The SGM Bands Indicator represents a significant advancement in technical analysis tools specifically designed for grid trading strategies. By providing intuitive visual cues and algorithmic analysis, it helps traders optimize entry and exit points, manage active positions, and achieve potentially higher profitability while managing risks more effectively.
By incorporating this powerful indicator into your trading approach, you gain enhanced ability to make informed decisions in the fast-paced cryptocurrency markets, potentially increasing your trading success.
"The difference between successful and unsuccessful traders often comes down to timing. Our SGM Bands Indicator gives you that edge." — SageMaster Research Team
Happy Trading!
The SageMaster Team
Disclaimer: Trading involves significant financial risk and can result in substantial losses. Past performance does not guarantee future results. SageMaster does not provide financial advice. Users should ensure compliance with local regulations.