Top Gainers & Volume
Top Gainers & Volume — How to use this Screener
Written By Ehsaan XP
Last updated 3 months ago
Navigation
Getting started with SGM Screener — The screener workflow, UI map, and full glossary.
Green Light Trend Rider — Trend-following candidates with less noise (beginner-friendly default).
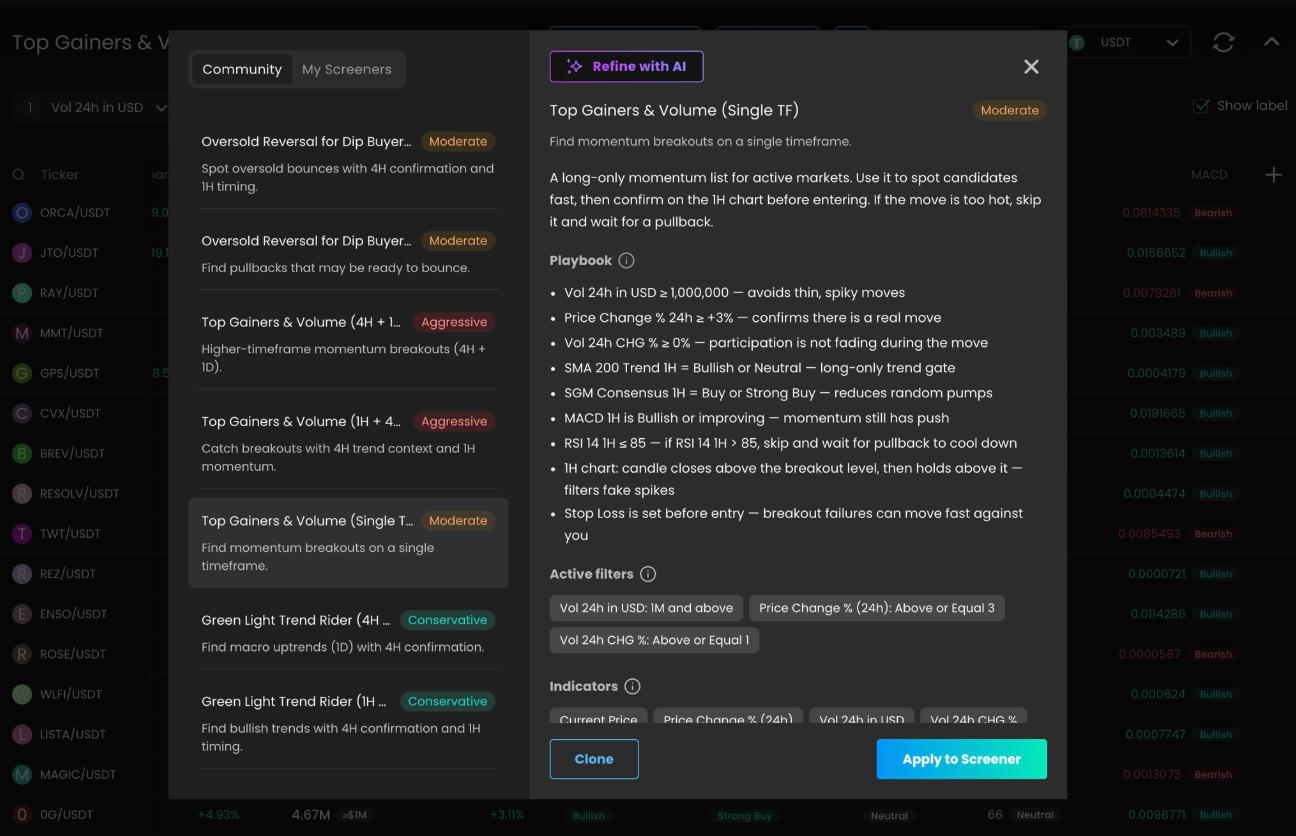
Oversold Reversal for Dip Buyers — Pullbacks that may be ready to bounce (needs stabilization + confirmation).
Overview
Top Gainers & Volume is a momentum Screener for days when markets are moving. It looks for price strength and then checks whether volume participation supports that move. If you use it well, it is one of the fastest ways to answer the question “what is actually hot right now”.
The trade-off is that momentum can flip quickly. This Screener is not about being right all the time. It is about filtering for participation, avoiding obvious exhaustion, and then using a strict risk plan so one failed breakout does not turn into a large drawdown.
Timeframe versions
This Screener is available in multiple timeframe versions. The multi-timeframe versions add context so you are less likely to buy a breakout that is fighting the bigger trend.
Single TF is the fastest version. It shows you what is moving now, but it also contains the most “noise”.
1H + 4H uses 4H for context and 1H for timing. It is a good default if you want breakouts but want fewer traps.
4H + 1D uses 1D for context and 4H for timing. It is designed for traders who want higher-timeframe breakouts and do not need constant action.
How to pick:
Choose Single TF when you are actively watching the screen and you are strict about not chasing.
Choose 1H + 4H when you want breakout candidates that are not fighting the 4H context.
Choose 4H + 1D when you prefer fewer signals, more patience, and more emphasis on macro direction.
If you choose a multi-timeframe version, follow its Playbook in Screener details. The order stays the same, but some checks move to 4H or 1D and thresholds can be stricter.
TL;DR
Use this on “markets are moving” days to find breakout candidates fast.
Volume confirmation matters, and the chart check matters even more.
Default Assist for this Screener: Instant DCA, with a defined Take Profit and strict caps.
When to use / when to skip
Use this Screener when the market is active and you want to follow strength. It works best when breakouts have participation and then form structure, such as a hold above the breakout level or a clean retest.
Be extra cautious when liquidity is thin, the move is a “one candle wonder” spike, or RSI is extremely high. Those are the moments where beginner entries often become instant drawdowns.
Concept
Breakouts that continue usually have participation behind them. Price can move on low volume, but those moves often fail quickly. This Screener combines “strength now” with a participation check so you do not confuse noise with a real move.
The second idea is psychological: if you do not have a rule that stops you from chasing, you will eventually buy the last candle. The Playbook’s heat checks and the chart check are there to protect you from that mistake.
What to expect
Expect higher volatility and more false signals than trend Screeners. Some days you will get too many results. That is your cue to be stricter, not faster.
In practice, many “good” momentum trades are not bought at the top of the first spike. They are taken after a hold or retest when you can define invalidation cleanly.
Benefits / risks
Benefits: quickly finds the markets that are actually moving right now and saves you from scrolling endless watchlists.
Risks: fake breakouts, slippage, emotional chasing, and sharp reversals. Treat risk planning as part of the setup, not an afterthought.
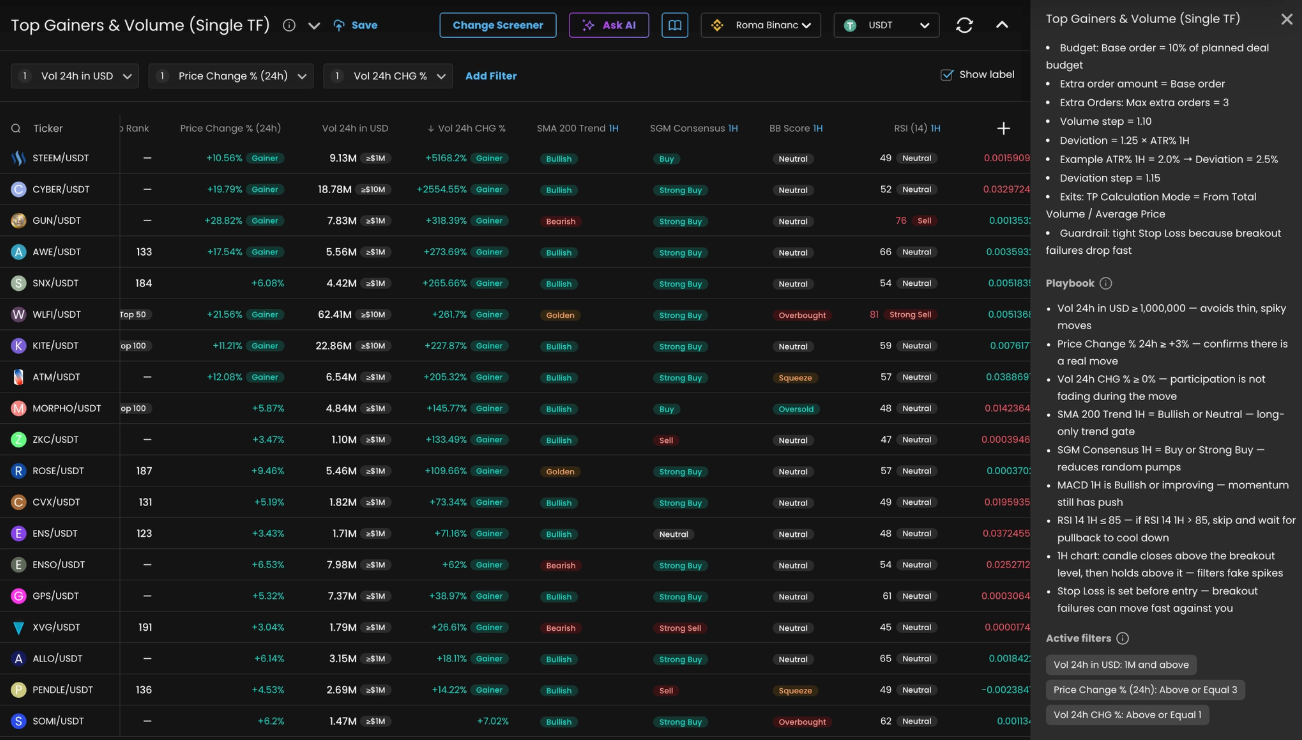
Playbook
Follow this checklist, then confirm on the entry timeframe chart for your chosen version. The “don’t chase” rule is there for a reason.
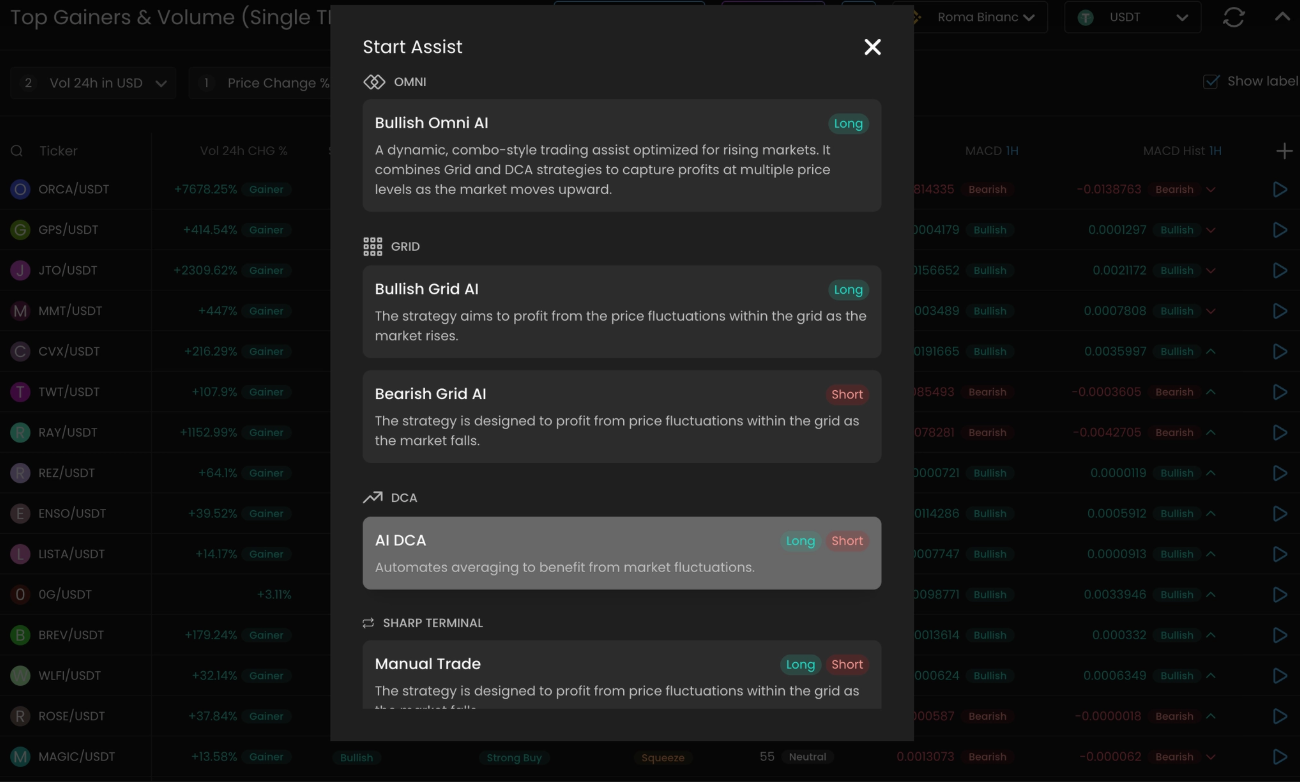
Pick an Assist
Never let an Assist run forever. Markets change regimes. Always define an exit plan. For better results, every Assist should have an explicit exit strategy. For GRID and OMNI, set an upper limit and a downside plan. For Instant DCA, set Take Profit, Stop Loss, and strict caps. This reduces the risk of slow bleed and “hope holding” when the market regime changes.
Recommended Instant DCA
Instant DCA is the best fit for this Screener because breakouts can reverse fast. A DCA plan with shallow coverage lets you participate while keeping risk defined, especially if you enter on a pullback or retest instead of buying the top.
Starter notes (from the template tips):
Base order = 10% of planned deal budget; extra order amount = base order.
Max extra orders 3; volume step 1.10.
Deviation ≈ 1.25× ATR % 1H; deviation step 1.10.
Must-set guardrails:
Set Take Profit before starting. A breakout Screener without a TP plan often turns into “I’ll just hold it”.
Set a tight Stop Loss aligned with invalidation. Failed breakouts can drop quickly.
Keep caps strict. If you need deep coverage, it is usually not a breakout anymore.
Alternative OMNI
OMNI can fit if you keep coverage very modest and use Upper Price Limit so you do not chase late entries. Think of it as a “breakout with a backup plan”, not a deep recovery bot in this context.
Starter setup guidance from the template tips:
DCA orders = 2
Trailing Up = ON
Upper Price Limit = ON
Must-set guardrails:
Set Upper Price Limit and keep coverage modest.
Define Take Profit, Stop Loss, and a review timebox so the Assist does not run forever.
Alternative GRID
GRID can fit after the breakout consolidates and forms a new range. Do not start the grid on the initial spike. Build it around the consolidation range and define stop prices so a strong continuation does not strand the grid out of range.
Step-by-step example
The steps below include screenshot placeholders you can replace later.
This example assumes Single TF for simplicity. If you selected a multi-timeframe version, keep the same flow but follow its Playbook checks and use the correct timing timeframe for the chart trigger.
Select the template.
Sort to find the strongest candidates (but don’t auto-buy #1).
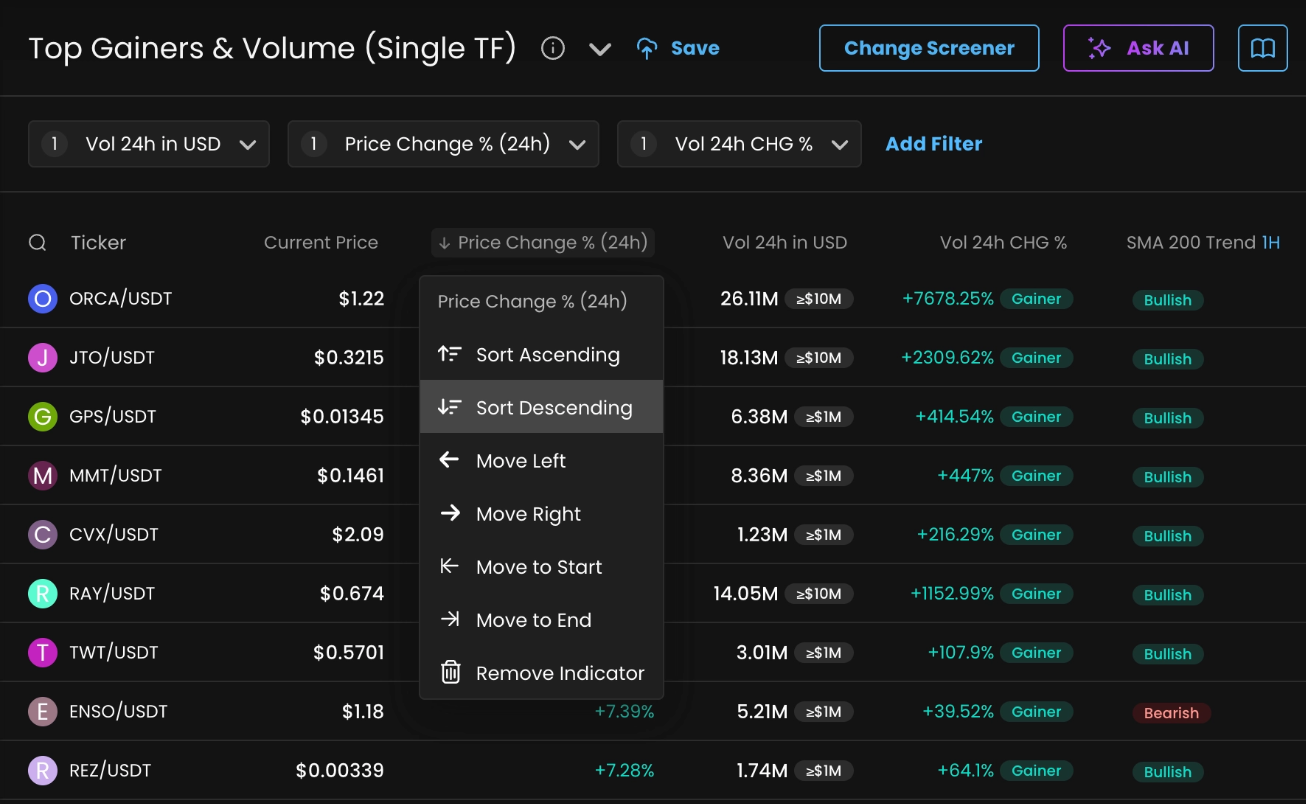
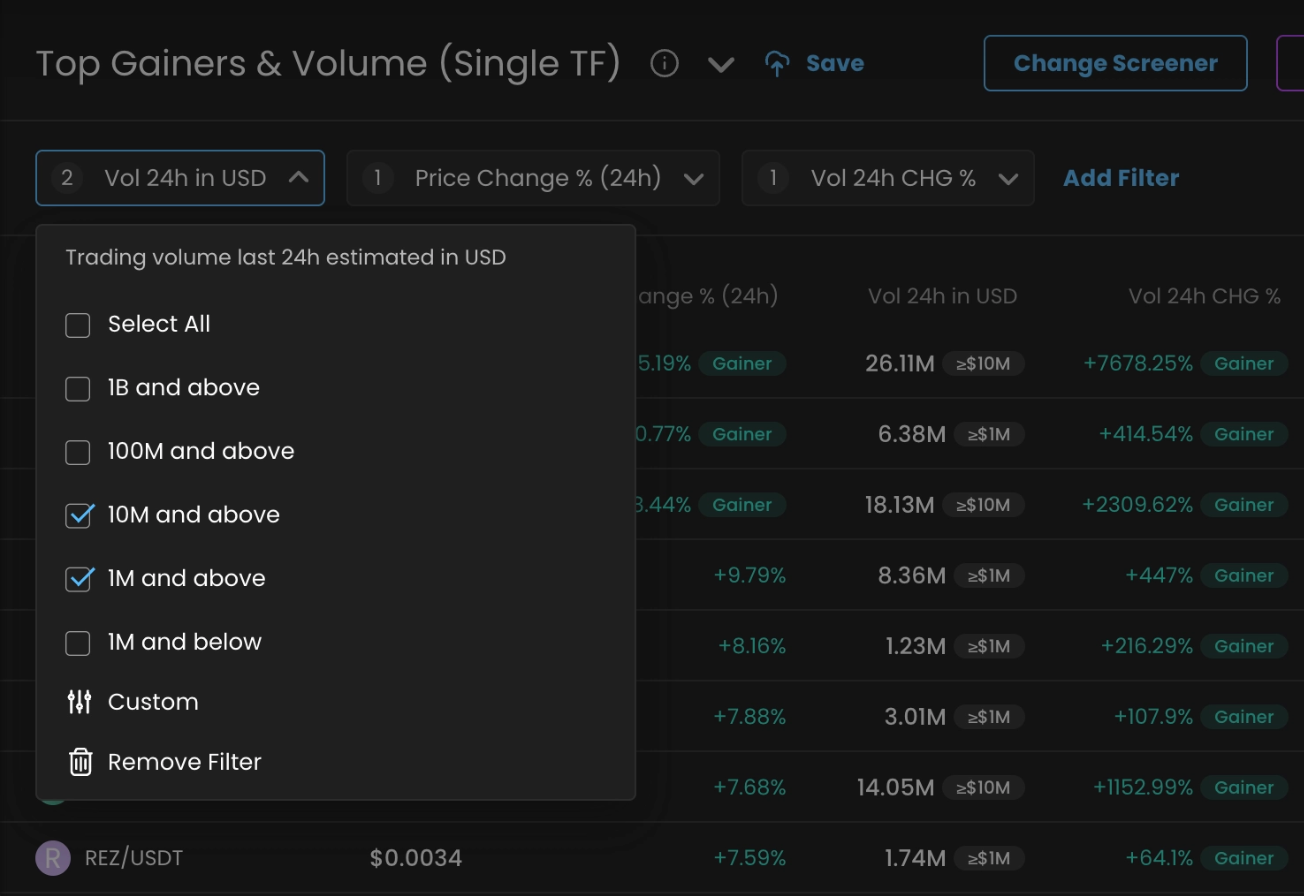
Apply the liquidity sanity check.
Open Screener info and follow the Playbook
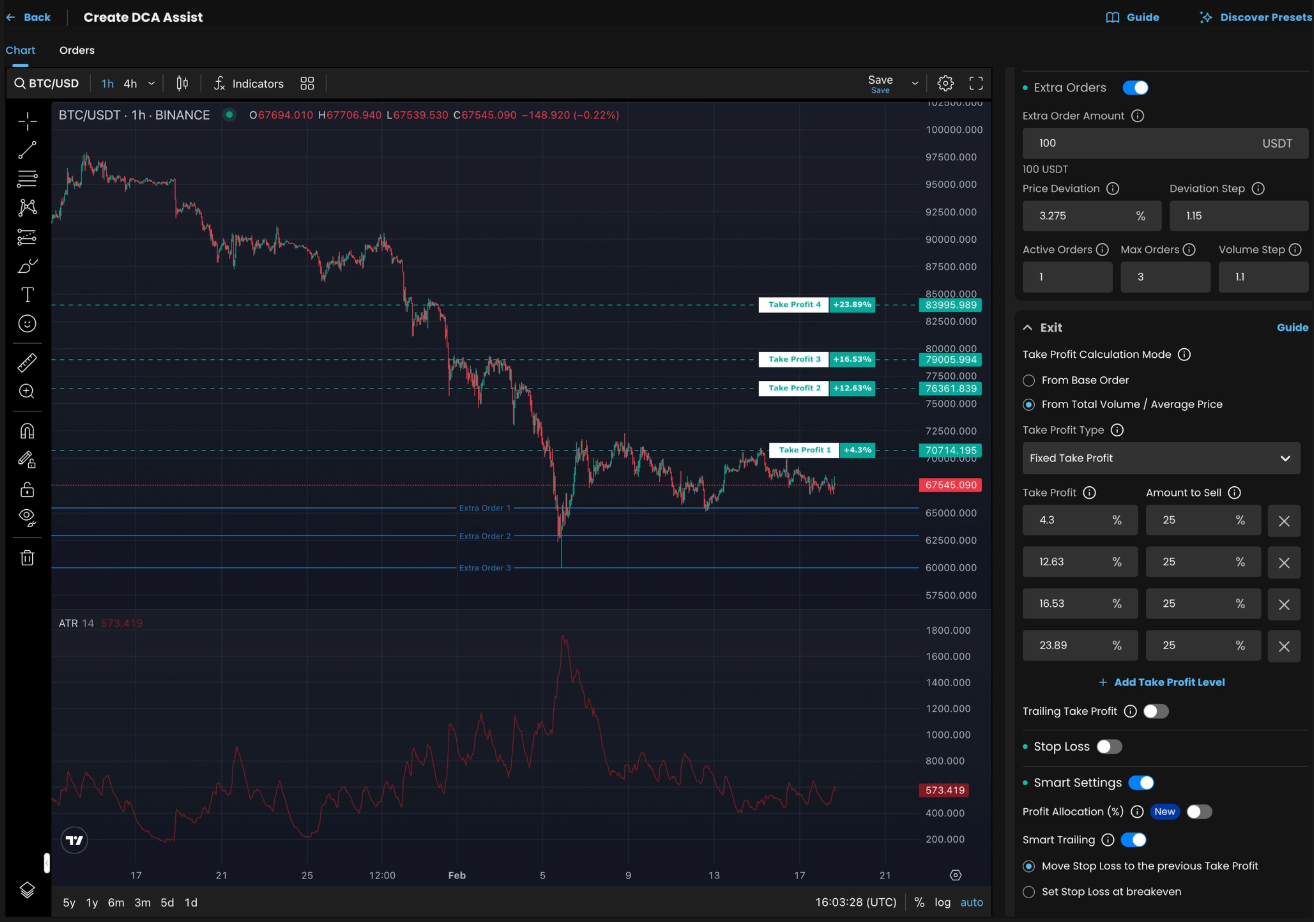
let’s pick WLFI/USDT
it is high liquidity (TOP 50 market cap)
it has recent Golden Cross
MACD is bullish and increasing
the only downsides are RSI and BB Score, but it still has a decent chance to break out
Start an Assist with shallow coverage.
Set proper settings to your Manual DCA
Base Order Amount same as Extra Order Amount
Enable Extra Orders
Max Orders = 3
Price Deviation = ATR% * 1.25 = 3.275
Deviation Step = 1.15
Volume Step = 1.10
Add 4 Take Profit levels based on recent resistance zones
Enable Smart Settings
Turn On Smart Trailing
Move Stop Loss to the previous Take Profit
Reminder: This guide is educational and not financial advice. Use your own risk management.