Case Studies & Performance Examples
Written By Ehsaan XP
Last updated 4 months ago
After learning about the advanced configuration options for Omni Assist, it's time to see this powerful strategy in action. Real-world case studies provide valuable insights into how Omni Assist performs across different market conditions and how specific configuration choices affect outcomes.
In this guide, we'll examine detailed case studies with actual performance metrics, demonstrating how Omni Assist can transform challenging market scenarios into profitable opportunities.
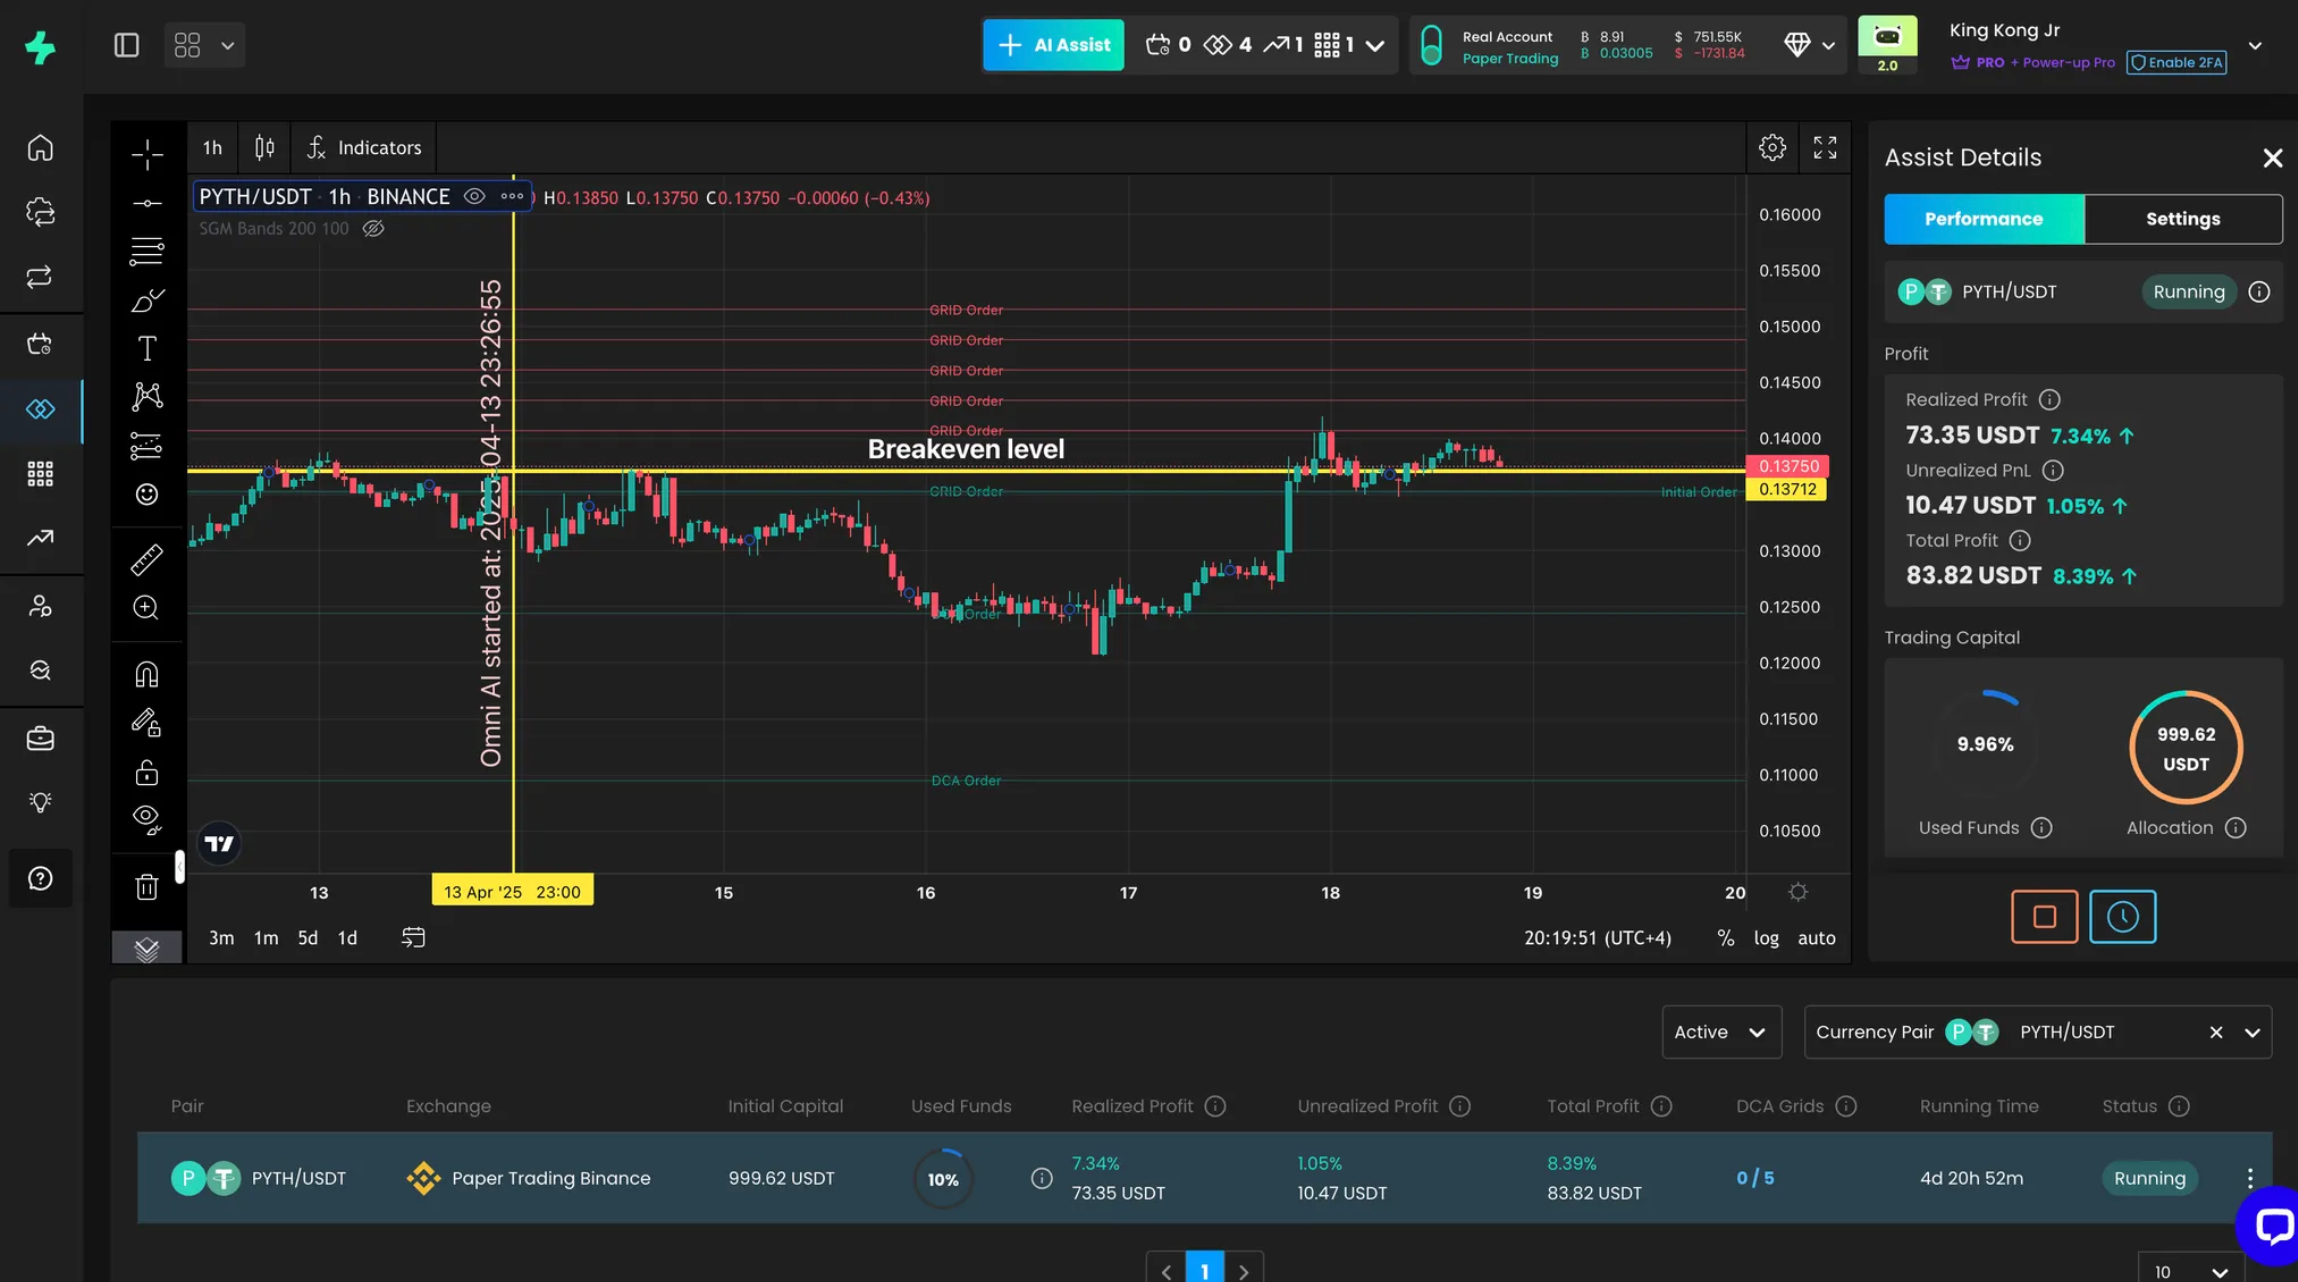
Case Study 1: Turning a 10% Drawdown into Profit
Trading Details
Trading Pair: PYTH/USDT
Allocated Capital: 1,000 USDT
Duration: 4 days, 20 hours
Market Condition: 10% price decline followed by partial recovery
Overview
This case study demonstrates the unique advantage of the Omni Assist AI by illustrating a real-life scenario where the AI transformed a potentially negative market situation—a 10% price dip—into a profitable outcome.
Strategy Configuration
Initial Entry Price: 0.137 USDT
Grid Width: 8%
Grid Levels: 6
DCA Configuration: 5 levels (Step Scale: 1.4, Volume Scale: 1.5)
Take Profit: Disabled (Range Mode)
Trailing: Enabled
The Market Scenario
PYTH initially hovered near the entry price without significant movement. Then, over a 36-hour period, the price fell approximately 10% to reach 0.122 USDT.
In a traditional grid or DCA strategy, this would represent a substantial floating loss, and the trader would be waiting passively for the market to recover fully.
Omni Assist's Response
As the price declined, Omni Assist automatically:
Triggered DCA Orders: The system placed buy orders at predetermined levels on the way down, acquiring more PYTH at lower prices
Created Sub-grids: Around each DCA level, Omni Assist established new sub-grids
Captured Oscillation Profits: As the price oscillated within the 0.122-0.130 USDT range, the sub-grids routed numerous micro-trades
Lowered Break-even Price: Each profitable sub-grid transaction effectively reduced the average cost of the entire position
Performance Metrics
Realized Profit: 73.35 USDT (+7.34%)
Unrealized Profit: 14.78 USDT (+1.48%)
Total Profit: 88.13 USDT (+8.82%)
Maximum Drawdown: -4.2% (significantly reduced by active sub-grid trading)
Capital Utilization: Peaked at 57% during the dip, reset to only 10% after profits were realized
Recovery Requirement: Only needed a 6% recovery from the bottom to reach profitability (vs. 11% for traditional strategies)
Key Takeaways
Omni Assist transformed what would have been a significant drawdown into a profitable outcome
The strategy didn't require a full price recovery to generate profit
Capital utilization remained efficient, with most funds freed up after the partial recovery
The dynamic break-even price reduction was key to achieving profitability despite adverse price movement
Case Study 2: Maximizing Profits in a Ranging Market
Trading Details
Trading Pair: BTC/USDT
Allocated Capital: 10,000 USDT
Duration: 14 days
Market Condition: Range-bound between $82,000-$89,000
Strategy Configuration
Initial Entry Price: $84,500
Grid Width: 9%
Grid Levels: 9 (1% increments)
DCA Configuration: 2 levels at $80,275 and $76,261 (Step Scale: 1.2, Volume Scale: 1.2)
Take Profit: Disabled to maximize grid recycling
Trailing: Disabled as market was range-bound
The Market Scenario
Bitcoin spent two weeks oscillating within a clearly defined range, repeatedly bouncing between $82,000 and $89,000. This type of sideways movement often frustrates traditional buy-and-hold investors but presents an ideal environment for grid-based strategies.
Omni Assist's Performance
During this period, Omni Assist:
Routed Frequent Grid Trades: The system completed 37 grid transactions as price moved within the range
Recycled Capital Efficiently: Profits from completed grid cycles were automatically reinvested
Maintained Protective DCA Levels: Although never triggered, the DCA levels provided protection against unexpected drops
Compounded Small Gains: Each grid transaction contributed to steadily increasing cumulative profit
Transaction Analysis
Performance Metrics
Total Grid Transactions: 37
Average Profit per Transaction: 18.11 USDT
Total Realized Profit: 670.12 USDT (+6.70%)
Annualized Return (extrapolated): ~174% APR
Maximum Capital Utilization: 62%
Maximum Unrealized Drawdown: -1.2% (minimal as price stayed within grid)
Key Takeaways
In ranging markets, Omni Assist excels through frequent, automated trading of the price oscillations
The cumulative effect of many small profits leads to significant returns over time
Even without triggering DCA levels, the strategy delivered strong performance through its grid component
Capital efficiency remained high as the system continuously recycled funds
Case Study 3: Navigating a Trending Market with Trailing Function
Trading Details
Trading Pair: ETH/USDT
Allocated Capital: 5,000 USDT
Duration: 21 days
Market Condition: Uptrend from $3,200 to $4,100
Strategy Configuration
Initial Entry Price: $3,200
Grid Width: 5%
Grid Levels: 5 (1% increments)
DCA Configuration: 2 levels (minimal as expecting uptrend)
Take Profit: 2% to enable quick profit taking and re-entry
Trailing: Enabled with 3% trailing distance
The Market Scenario
Ethereum entered a strong uptrend, rising from $3,200 to $4,100 over a three-week period. While the movement wasn't perfectly linear, the overall direction was clearly upward with several small retracements along the way.
Omni Assist's Performance
During this uptrend, Omni Assist:
Initially Captured Grid Profits: Completed several grid cycles in the $3,200-$3,360 range
Activated Trailing Functionality: As ETH broke above $3,360, the entire grid began trailing upward
Continuously Adjusted Grid Levels: The grid shifted multiple times, following the price higher
Captured Both Trend and Oscillation Profits: Generated returns from both the overall upward movement and smaller retracements
Grid Adjustment Timeline
Performance Metrics
Total Grid Transactions: 27
Total Realized Profit: 583.45 USDT (+11.67%)
Unrealized Profit (Position Value Increase): 437.50 USDT (+8.75%)
Combined Performance: +20.42%
Trailing Adjustments: 4 major grid shifts
Capital Utilization: Average 45% throughout period
Key Takeaways
Omni Assist's trailing functionality allowed it to follow the uptrend, unlike static grid strategies
The strategy generated profits from both the overall trend and minor retracements
By continuously adjusting grid levels, the system maintained optimal positioning throughout the trend
The combination of realized grid profits and position value appreciation maximized total returns
Case Study 4: Deep Drawdown Recovery
Trading Details
Trading Pair: SOL/USDT
Allocated Capital: 8,000 USDT
Duration: 32 days
Market Condition: Sharp 25% decline followed by partial recovery
Strategy Configuration
Initial Entry Price: $140
Grid Width: 6%
Grid Levels: 6
DCA Configuration: 5 levels with aggressive scaling (Step Scale: 1.5, Volume Scale: 1.6)
Take Profit: 4% (set higher to capture substantial rebounds)
Trailing: Disabled during downtrend
The Market Scenario
Solana experienced a sharp correction, dropping 25% from $140 to $105 over two weeks, followed by a partial recovery to $125 (still 10.7% below the initial entry).
For most trading strategies, this would represent a significant loss position, as the asset remained well below the initial entry price even after the partial recovery.
Omni Assist's Response
As SOL declined, Omni Assist implemented its multi-layered approach:
Sequential DCA Activation: Five DCA levels were triggered at approximately:
$130.20 (-7% from entry)
$115.93 (-17.2% from entry)
$99.70 (-28.8% from entry)
$84.75 (-39.5% from entry)
$71.03 (-49.3% from entry)
Sub-grid Deployment: Each DCA level created its own sub-grid, actively trading smaller movements
Position Building: Volume Scale of 1.6 meant each subsequent DCA level purchased significantly more SOL than the previous one
Recovery Trading: As price rebounded from $105 to $125, multiple sub-grids captured profits from the recovery movement
Breakeven Analysis
Performance Metrics
Initial Drawdown: -25% (from $140 to $105)
Recovery Movement: +19% (from $105 to $125)
Traditional Strategy Result: -10.7% (still in loss as price below entry)
Omni Assist Result: +3.8% profit (despite price being 10.7% below initial entry)
Sub-grid Transactions: 42 completed grid cycles across all sub-grids
Maximum Capital Utilization: 86% (at maximum drawdown)
Recovery Requirement: Reached profitability at $118 (vs. $140 entry price)
Key Takeaways
Omni Assist demonstrated its ability to generate profits even when the asset remains significantly below the initial entry price
The combination of strategic DCA positioning and active sub-grid trading dramatically reduced the effective break-even price
The strategy transformed what would typically be a losing position into a profitable one
The aggressive Step Scale and Volume Scale settings were crucial for maximizing the strategy's effectiveness in a deep drawdown scenario
Comparative Analysis: Omni Assist vs. Traditional Strategies
To better understand Omni Assist's unique advantages, let's compare its performance against traditional strategies across different market conditions:
Sideways Market Comparison (14-day period, BTC/USDT)
Uptrend Market Comparison (21-day period, ETH/USDT)
Downtrend Recovery Comparison (32-day period, SOL/USDT)
Performance Insights and Patterns
After analyzing multiple case studies and performance data, several patterns emerge that highlight Omni Assist's strengths:
1. Recovery Efficiency
Omni Assist consistently requires less price recovery to reach profitability compared to traditional strategies. This "recovery efficiency advantage" typically ranges from 10-20%, meaning Omni Assist can be profitable with only 80-90% price recovery compared to traditional strategies requiring full recovery.
2. Adaptive Performance
The strategy demonstrates strong adaptability across market conditions:
In sideways markets: Outperforms through maximized grid trading
In uptrends: Captures both trend and oscillation profits
In downtrends: Transforms drawdowns into opportunities through sub-grid activity
3. Capital Utilization Balance
Omni Assist strikes an effective balance in capital deployment:
Sufficient capital utilization to maximize profit opportunities
Strategic reserve maintenance for deeper DCA levels if needed
Efficient capital recycling as profits are realized
4. Psychological Advantage
Beyond pure performance metrics, users report significant psychological benefits:
Reduced anxiety during drawdowns as sub-grids remain active
Greater confidence in strategy longevity and resilience
Less temptation to manually intervene during volatile periods
Implementation Recommendations Based on Case Studies
Drawing from these real-world examples, we can extract practical recommendations for implementing Omni Assist:
For Sideways Markets (Case Study 2)
Optimize for grid component with wider grid width (8-10%)
Use moderate Step and Volume Scales (1.1-1.3)
Disable Take Profit to maximize grid recycling
Consider higher grid density (8-10 levels) to increase transaction frequency
For Uptrending Markets (Case Study 3)
Enable trailing functionality with 2-3% trailing distance
Use narrower grid width (4-6%) for more frequent trading during retracements
Set moderate Take Profit (1-3%) to enable quick profit realization and re-entry
Minimize DCA depth as significant drawdowns are less likely
For Downtrend Protection (Case Study 4)
Configure aggressive Step Scale (1.4-1.6) to properly space DCA levels
Implement higher Volume Scale (1.5-1.8) to effectively reduce average cost
Set higher Take Profit (3-5%) for sub-grids to capture substantial rebounds
Extend DCA depth to cover potential worst-case scenarios
Limitations and Considerations
While these case studies demonstrate Omni Assist's effectiveness, important considerations should be noted:
Capital Requirements: Deep DCA configurations require substantial capital reserves
Parameter Sensitivity: Performance can vary significantly based on specific parameter settings
Market Structure Dependency: Extreme market conditions may still challenge even the most robust configuration
Exchange Limitations: Some exchanges may have restrictions that affect full implementation
Conclusion
These case studies demonstrate how Omni Assist transforms traditional trading challenges into opportunities through its hybrid approach. By combining the strengths of grid trading and DCA strategies, Omni Assist:
Generates profits in sideways markets through efficient grid trading
Follows uptrends with trailing functionality to maximize upside
Transforms drawdowns into profit opportunities through sub-grid trading
Significantly reduces the price recovery required to reach profitability
As with any trading strategy, results will vary based on market conditions, configuration choices, and individual implementation. However, these real-world examples provide compelling evidence of Omni Assist's versatility and effectiveness across diverse market scenarios.
Ready to experience these results yourself? Return to Setting Up Your First Omni Assist Strategy to begin implementing your own Omni Assist strategy.
Happy Trading!
The SageMaster Team
Disclaimer: Trading involves significant financial risk and can result in substantial losses. Past performance does not guarantee future results. SageMaster does not provide financial advice. Users should ensure compliance with local regulations.