Screener and Filters
Using Grid Assist Filters: Enhancing Your Trading Strategy
Written By Ehsaan XP
Last updated 7 months ago
Introduction
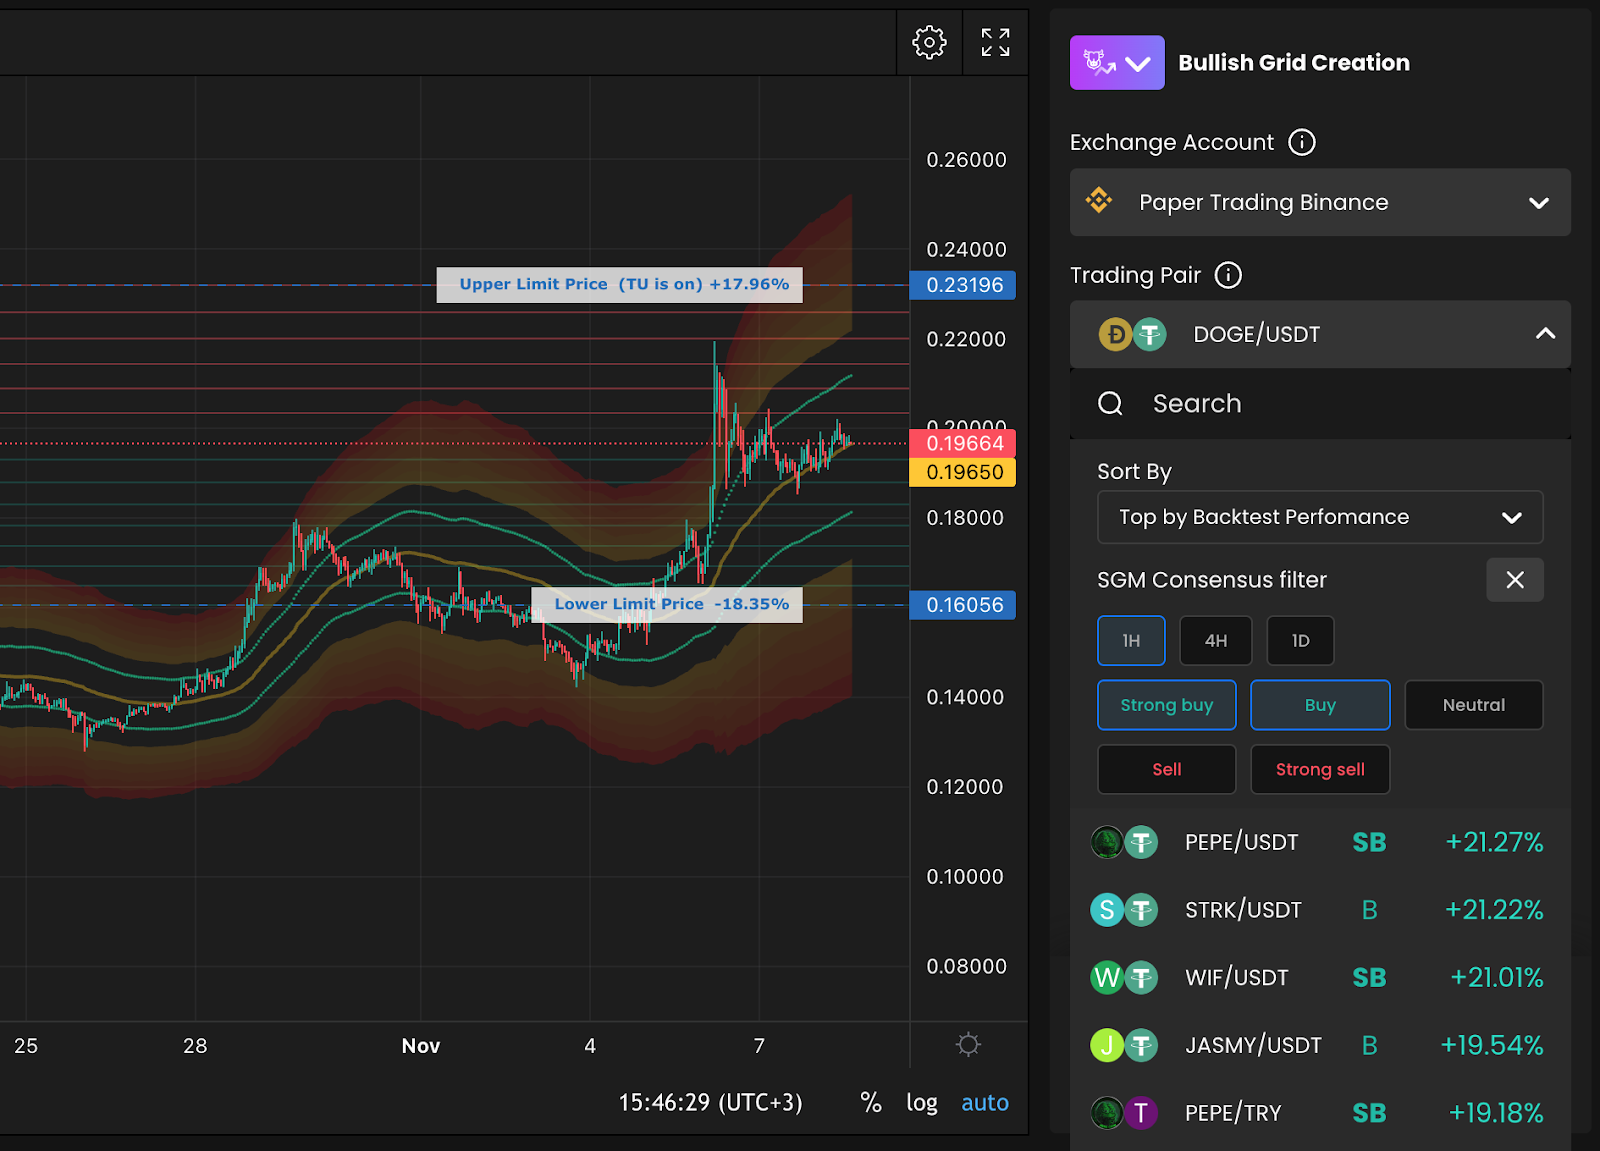
The Screener Filter feature in Grid Assist is a powerful tool designed to enhance your trading experience by providing valuable insights for identifying optimal trading pairs. This guide explores how to effectively use these filters to maximize your grid trading success.
What is the Screener Filter?
Originally developed as part of SageMaster's MasterGPT AI, the Screener functionality has been integrated directly into the Grid UI page. This feature leverages the SGM Consensus Indicator to provide aggregated technical ratings across various cryptocurrency markets.
SGM Consensus Indicator
The SGM Consensus Indicator is a proprietary technical analysis tool that offers aggregated ratings for financial instruments, categorizing assets into five distinct values:
STRONG BUY: Highly favorable technical indicators suggesting significant upward potential
BUY: Positive technical outlook indicating potential for price appreciation
NEUTRAL: Balanced technical signals without a clear directional bias
SELL: Negative technical outlook suggesting potential price depreciation
STRONG SELL: Highly unfavorable technical indicators suggesting significant downward potential
How to Use the Screener Filter
Follow these steps to utilize the Screener Filter within Grid Assist:
Access Your Grid Page: Open your grid page and begin selecting a trading pair
Add a Filter: Click on the "Add filter" button
Select Timeframes and Values: Choose your desired timeframes and screener values to narrow down potential trading pairs
Understanding Timeframes and Screener Values
Timeframes
The Screener Filter allows you to select from three timeframes, each suited for different trading horizons:
1h (1 Hour): Ideal for short-term Grids lasting up to a week. This timeframe suits traders looking for quick opportunities. Always conduct your own research or consult MasterGPT to understand the current market regime and overall direction.
4h (4 Hours): Suitable for medium-term Grids that span a month or two. This timeframe helps identify pairs with stable trends over a moderate period.
1d (1 Day): Indicates long-term market regimes, perfect for long-term Grids. Use this timeframe to find pairs with enduring trends.
Screener Values
For effective grid trading, focus on selecting the appropriate consensus values:
For bullish Grid strategies, we recommend focusing on pairs with STRONG BUY or BUY ratings
For bearish Grid strategies, consider pairs with STRONG SELL or SELL ratings
NEUTRAL ratings may be suitable for range-bound strategies
Using the SGM Bands Indicator in Conjunction
For optimal results, SageMaster recommends using both the SGM Consensus Indicator and the SGM Bands Indicator together. The SGM Bands Indicator displays the current market trading channel along with overbought and oversold zones.
Important Consideration
Sometimes, a pair may have a BUY Consensus rating but already be significantly overbought according to the SGM Bands Indicator. In such cases, there might be limited potential for further price increases, making it a less optimal choice for a new grid strategy.
Recommended Approach
To make the most of the Screener Filter and SGM Bands Indicator, follow these steps:
Filter Pairs: Begin by filtering for pairs with STRONG BUY or BUY scoring values (for bullish strategies)
Analyze the Chart: Open each pair and examine the chart using the SGM Bands Indicator
Assess Overbought/Oversold Conditions: If the price is already in the overbought or extreme overbought zones, consider it a riskier trade decision
Select Viable Pairs: Identify a few pairs that are within a reasonable trading range and not excessively overbought or oversold
Initiate Your Grid: Decide which pairs you want to start a Grid with, based on your analysis
Advanced Filtering Strategies
Combining Multiple Timeframes
For more robust trading decisions, consider filtering with multiple timeframes:
Look for assets that show BUY or STRONG BUY signals across different timeframes
Assets with consistent ratings across timeframes often indicate stronger, more reliable trends
Pairing with Volume Filters
High technical ratings combined with strong trading volume can indicate higher conviction moves:
Consider focusing on assets that not only have favorable ratings but also demonstrate above-average trading volume
Higher volume typically suggests stronger market participation and potentially more reliable price movements
Trend Confirmation
Use the Screener Filter as an initial screening tool, then confirm trends with additional analysis:
After identifying potential pairs through the filter, analyze price action to confirm the presence of the anticipated trend
Look for consistent higher highs and higher lows (for uptrends) or lower highs and lower lows (for downtrends)
More info - How to use Screener Filters for GRID Assist
Conclusion
The Screener Filter in Grid Assist provides a powerful way to identify potential trading pairs based on technical analysis. By effectively utilizing this feature alongside the SGM Bands Indicator, you can make more informed trading decisions and potentially increase your success rate with grid strategies.
Remember that while these tools provide valuable insights, they should be part of a comprehensive trading approach that includes risk management and continuous market analysis. The combination of algorithmic filtering with visual confirmation through the SGM Bands Indicator creates a robust framework for identifying optimal grid trading opportunities.
"The right tools don't just help you trade; they transform how you see the market. Our filters are designed to bring clarity to complexity." — SageMaster Analytics Team
Happy Trading!
The SageMaster Team
Disclaimer: Trading involves significant financial risk and can result in substantial losses. Past performance does not guarantee future results. SageMaster does not provide financial advice. Users should ensure compliance with local regulations.