Green Light Trend Rider
Green Light Trend Rider — How to use this Screener
Written By Ehsaan XP
Last updated 3 months ago
Navigation
Getting started with SGM Screener — The screener workflow, UI map, and full glossary.
Top Gainers & Volume — Momentum breakouts with volume confirmation (fast moves, higher risk).
Oversold Reversal for Dip Buyers — Pullbacks that may be ready to bounce (needs stabilization + confirmation).
Overview
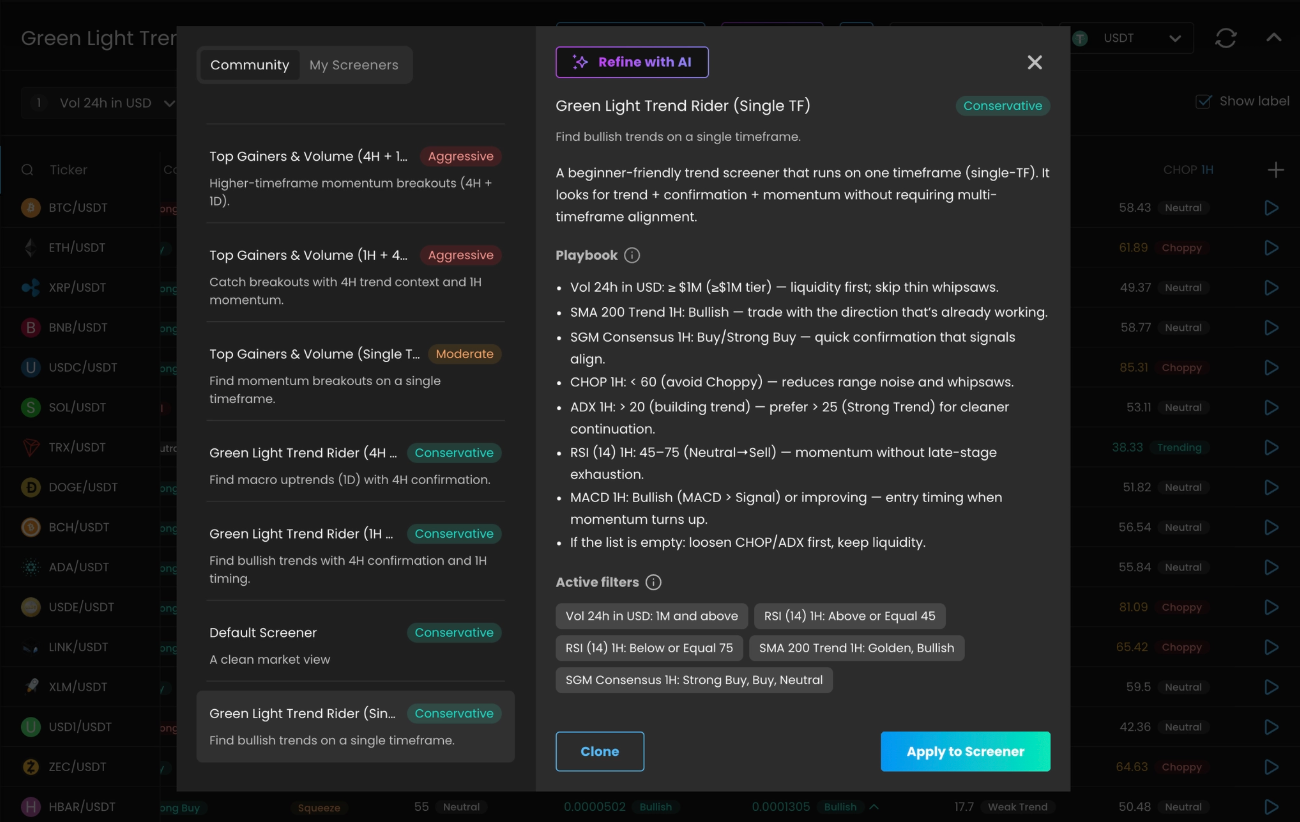
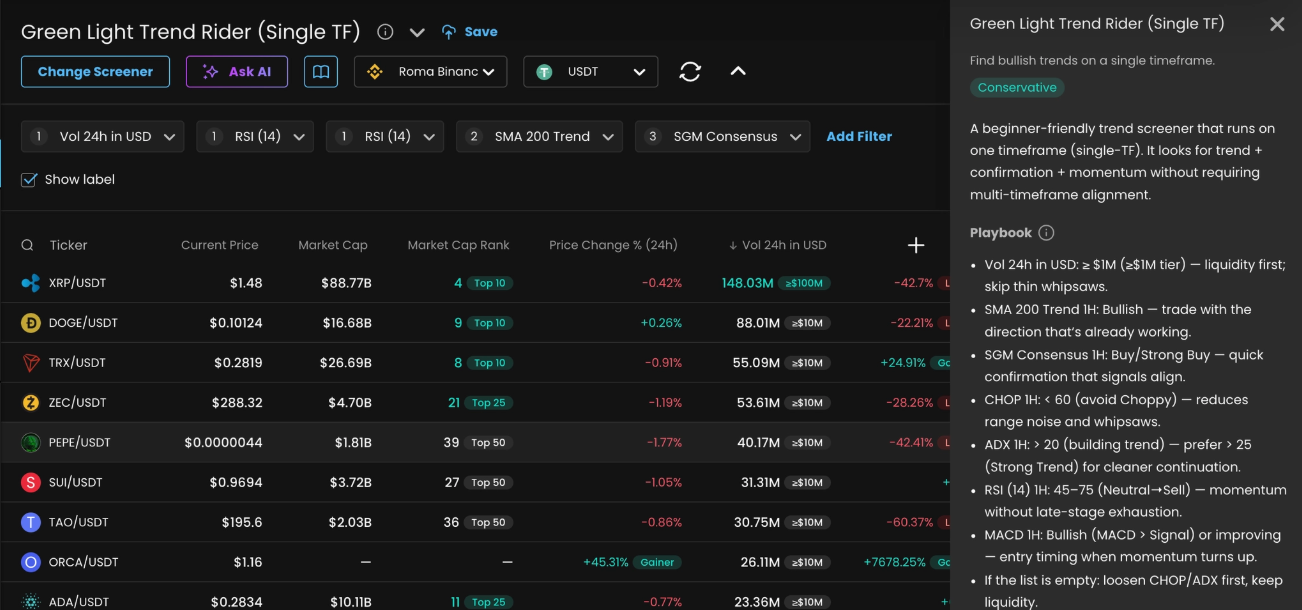
Green Light Trend Rider is a trend-continuation Screener. It is long-only by design and aims to find pairs that are already behaving like a healthy uptrend: tradeable liquidity, bullish trend bias, low “chop”, and momentum that still supports continuation.
The main benefit of this Screener is that it gives you fewer, cleaner candidates. You still need a chart check, but the table usually contains less “randomness” than momentum screens.
Timeframe versions
This Screener is available in multiple timeframe versions. The difference is which timeframe is treated as context and which timeframe is treated as entry timing.
Single TF is faster and noisier. You get more candidates, but you must be stricter with the chart check because one timeframe can lie.
1H + 4H uses 4H as the context filter and 1H as the timing filter. It usually produces fewer candidates and fewer whipsaws.
4H + 1D is the slowest version. It uses 1D to keep you on the macro side and 4H for timing. It typically has the cleanest signal quality, but you wait more and holds tend to be longer.
How to pick:
Choose Single TF when you want more opportunities and you can actively monitor trades.
Choose 1H + 4H when the market feels messy and you want trend confirmation before you take 1H entries.
Choose 4H + 1D when you trade less frequently and prefer higher-conviction trend continuation setups.
If you choose a multi-timeframe version, follow its Playbook in Screener details. The logic is the same, but some checks move to 4H or 1D and thresholds can be stricter.
TL;DR
Best for “clean trend” days, when you want fewer but higher-quality candidates.
Validate the row with the Playbook, then confirm structure on the entry timeframe chart for your chosen version.
Default Assist for this Screener: GRID using Bullish Grid AI, with tight bounds and a defined exit plan.
When to use / when to skip
Use this Screener when price structure is behaving and you want to trade with the prevailing direction instead of chasing candles. It works best when the market is already trending and pullbacks are “normal” rather than chaotic.
Be extra selective when the market is choppy/sideways, liquidity is thin, or RSI is extremely hot. Those are the conditions that create whipsaws and late entries.
Concept
Trends often persist, but most losses come from two beginner mistakes: treating chop as a trend, and entering too late after the easy part of the move. Green Light Trend Rider is built to reduce those mistakes by stacking a direction filter, a regime filter, and momentum checks.
The Screener does not try to predict the future. It tries to increase the odds that you are trading “trend behavior” instead of “random behavior”, and then it pushes you to define invalidation so you do not get trapped when the regime changes.
What to expect
You’ll usually see fewer candidates than momentum Screeners. The charts may look boring, and that is often a good thing. Your decision cadence is: shortlist a few pairs, confirm structure, start an Assist with a clear exit plan, and reassess if the structure breaks.
You may miss some early moves. The trade-off is that you also avoid many low-quality entries that look exciting in the moment.
Benefits / risks
Benefits: clearer decision-making (trend + confirmation + timing) and easier risk planning (swing structure gives clean invalidation levels).
Risks: sideways chop creates whipsaws, late entries can pull back hard, and trend breaks can be fast. Always define invalidation before you start an Assist.
Playbook
Use this checklist top-to-bottom. You don’t need perfection — you need a clean story.
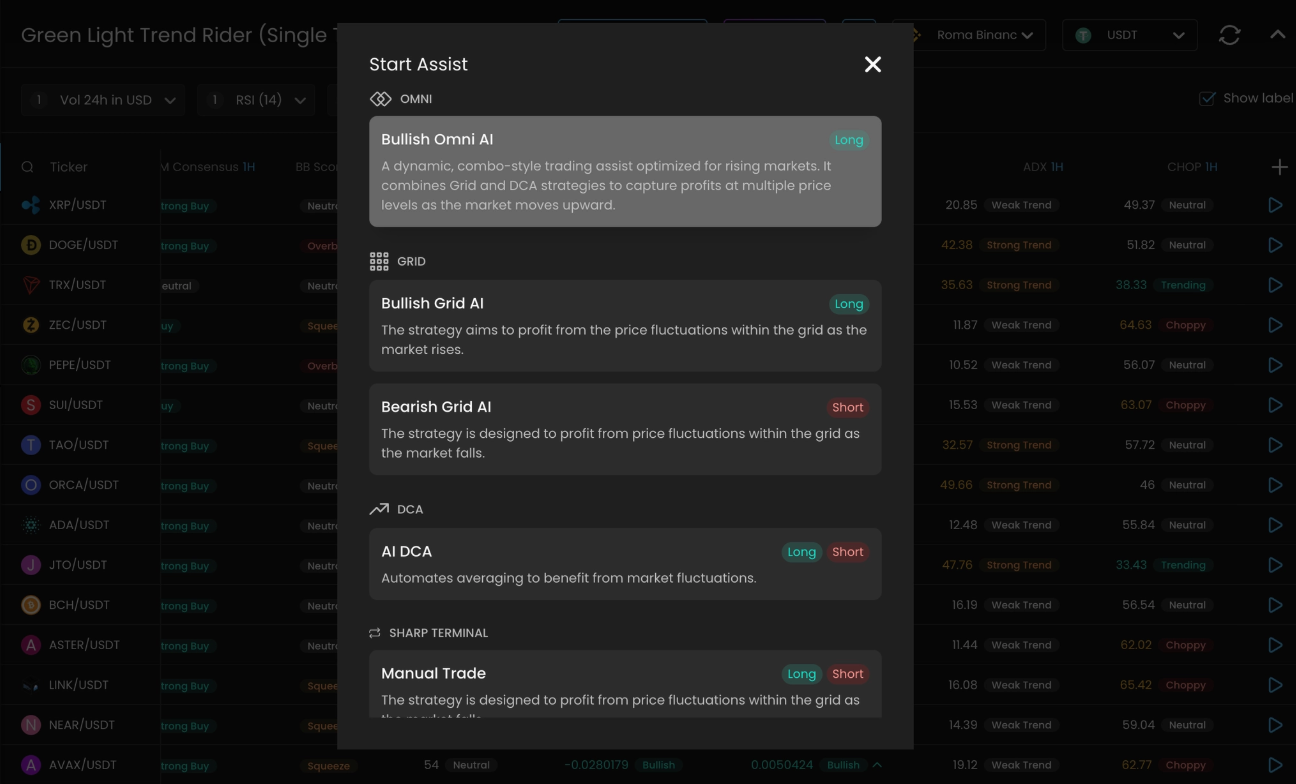
Pick an Assist
Never let an Assist run forever. Markets change regimes. Always define an exit plan. For better results, every Assist should have an explicit exit strategy. For GRID and OMNI, set an upper limit and a downside plan. For Instant DCA, set Take Profit, Stop Loss, and strict caps. This reduces the risk of slow bleed and “hope holding” when the market regime changes.
Recommended GRID
Grid execution fits this Screener because many trend continuations are “two steps forward, one step back”. A tight bullish grid can capture pullbacks and bounces inside a defined range, as long as you are honest about invalidation and you do not keep the grid running when trend structure breaks.
Starter notes from the template tips:
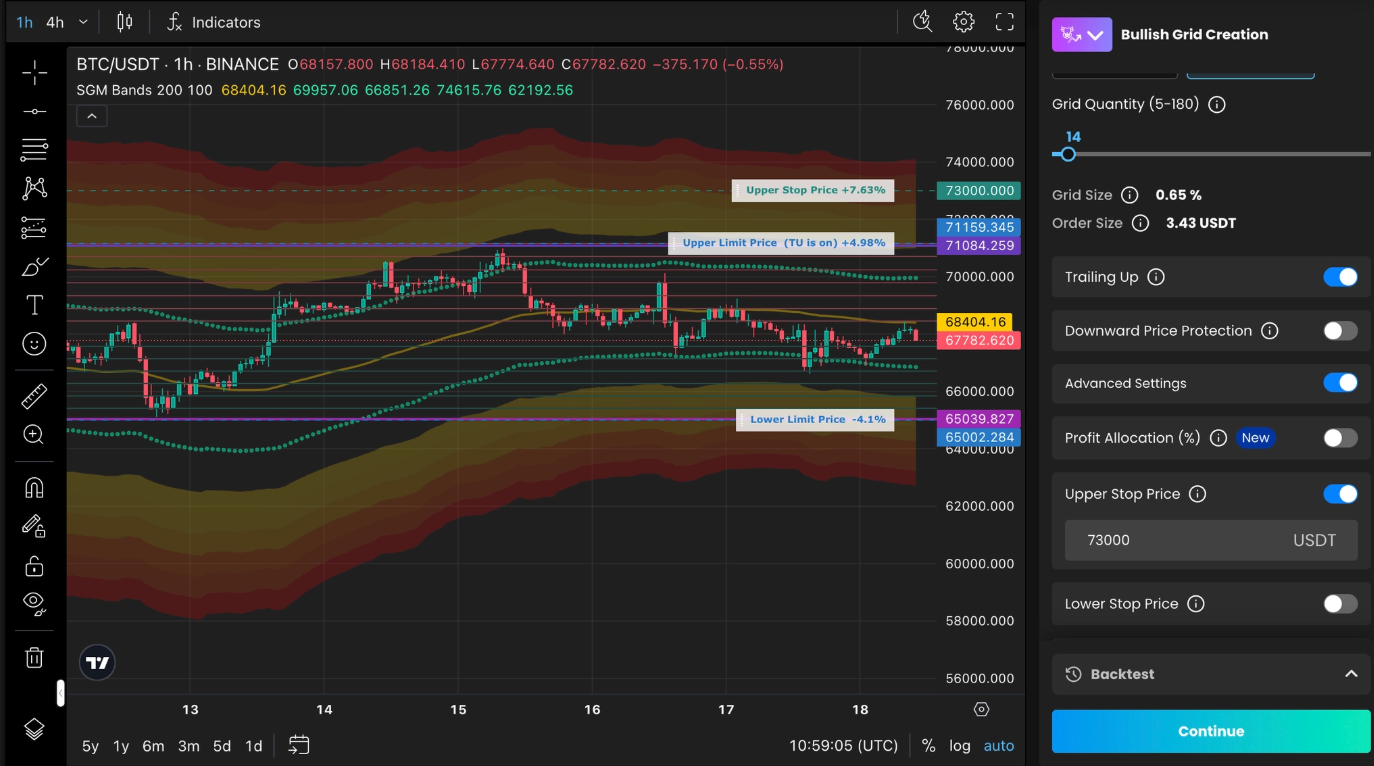
Type: Bullish AI GRID
Set Lower Grid Price near the last higher-low support zone.
Set Upper Grid Price near the next resistance zone.
Set Upper Stop Price near SGM Bands oversold area.
Keep the range tight: cover normal pullbacks, not the whole move.
Trailing Up: turn it on only after price makes a new swing high and holds above it.
Must-set guardrails:
Define Upper Grid Price and Lower Grid Price before starting.
Choose one downside plan: Lower Stop Price as a hard exit, or Price Protection if you accept deeper pullbacks.
Define a stop or invalidation based on structure, and do not keep the grid running if the trend breaks.
Define an exit plan for winners, such as an Upper Stop Price, a Take Profit rule, or a timebox for review, so the grid does not run forever.
Alternative OMNI
OMNI can fit when you want a more hands-off approach and you expect pullbacks but still want continuation behavior. Keep coverage shallow in clean trends and use Upper Price Limit so you do not chase late entries.
Starter setup (from the template tips):
DCA orders = 3
Trailing Up = ON
Upper Price Limit = ON (so you don’t chase late entries)
Must-set guardrails:
Set Upper Price Limit and a clear Stop Loss / invalidation below the last higher low.
Define Take Profit or a review timebox so the Assist does not run forever.
Alternative Instant DCA
Instant DCA fits when you want a simpler “average-in on pullbacks” approach with strict caps.
Starter notes (from the template tips):
Base order ≈ 15% of planned deal budget; extra order amount = base order.
Max extra orders 4; volume step 1.15.
Deviation ≈ 1× ATR % 1H; deviation step 1.10.
Must-set guardrails:
Set Take Profit before starting, so a trend run does not turn into “I’ll just hold it”.
Ensure total planned orders fit your budget, and set a final Stop Loss for trend breaks.
Step-by-step example
The steps below include screenshot placeholders you can replace later.
This example assumes Single TF for simplicity. If you selected a multi-timeframe version, keep the same flow but follow its Playbook checks and use the correct timing timeframe for the chart trigger.
Open SGM Screener.
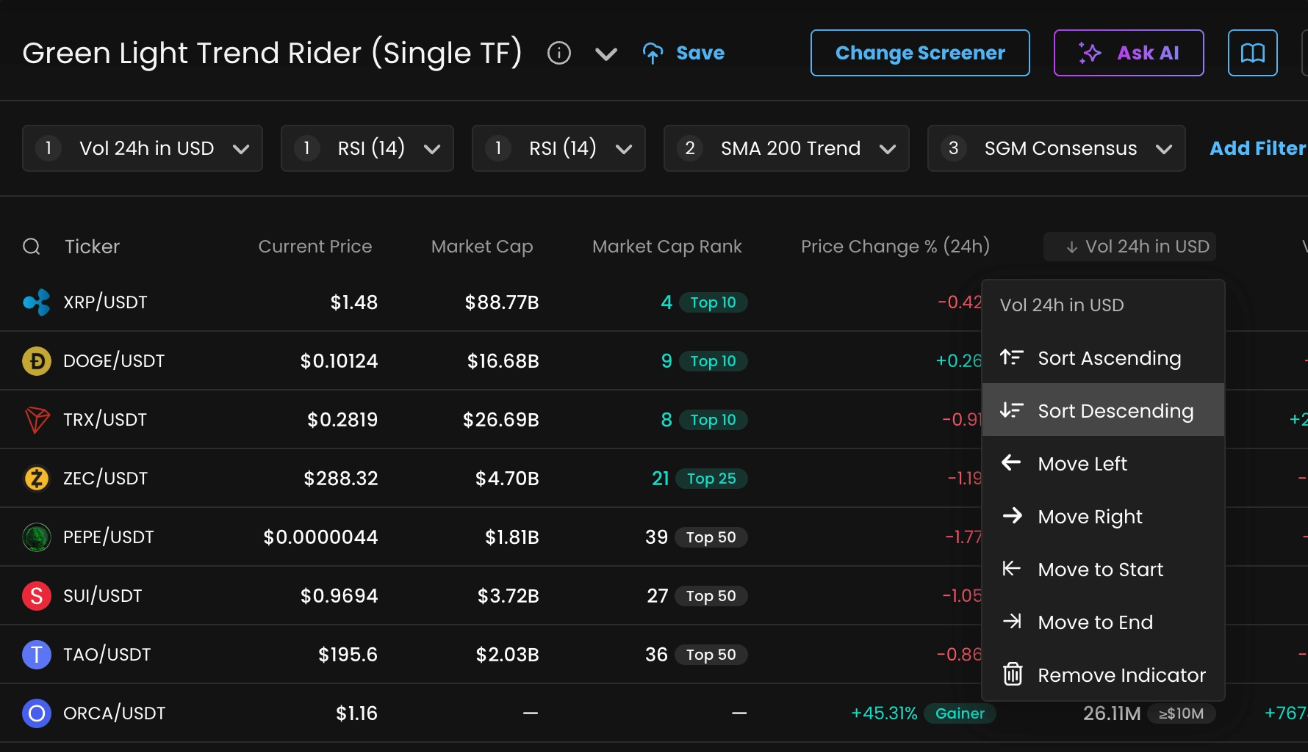
Sort by liquidity so you don’t waste time on thin markets.
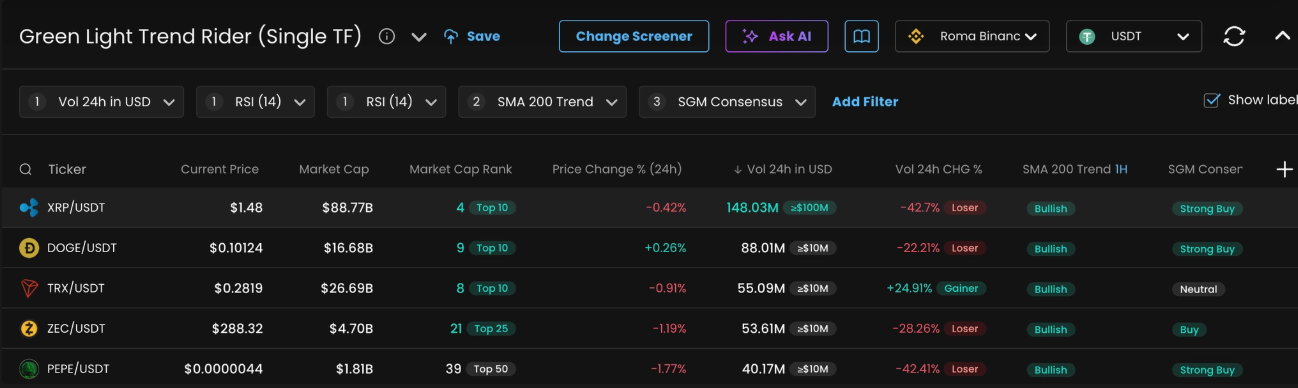
Pick 3–10 “mostly matching” rows.
Open Screener info and read the Playbook top-to-bottom.
Start an Assist on your best pick.
Adjust AI Settings for your GRID
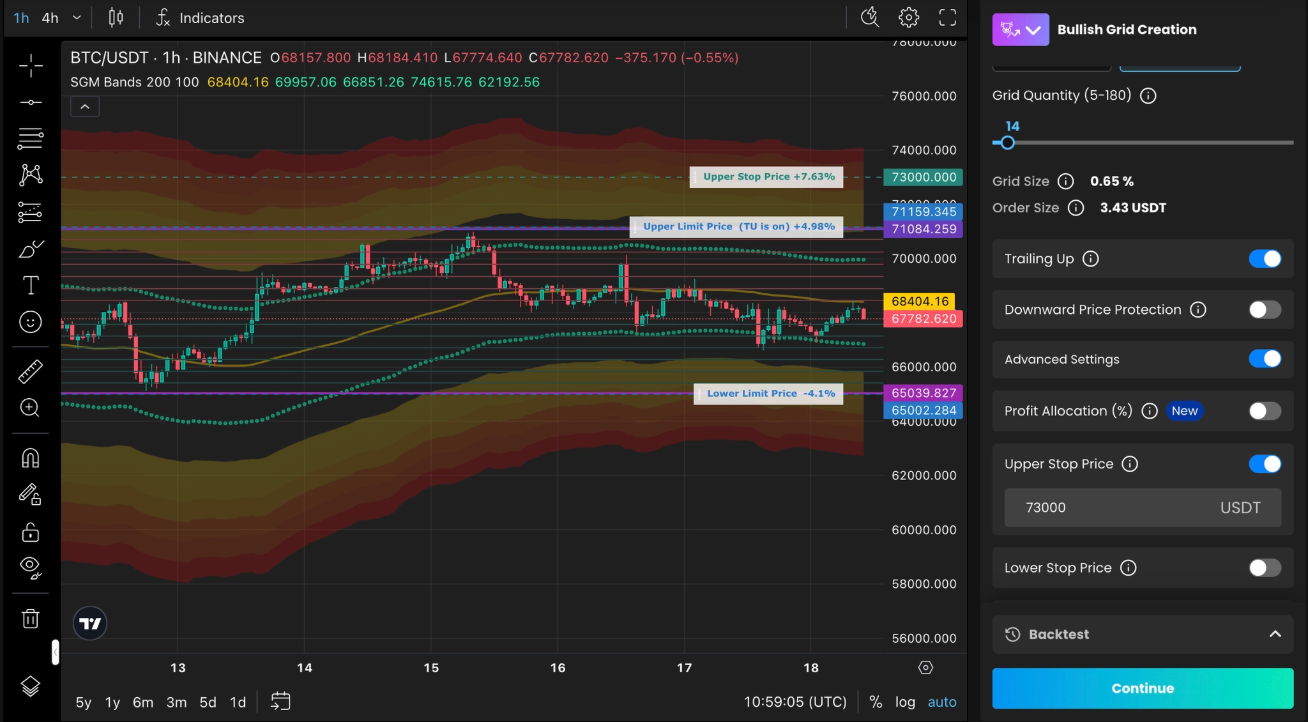
Set Lower Grid Price near the last higher-low support zone.
Set Upper Grid Price near the next resistance zone.
Set Upper Stop Price near SGM Bands oversold area.
Keep the range tight: cover normal pullbacks, not the whole move.
Trailing Up: turn it on only after price makes a new swing high and holds above it.
Reminder: This guide is educational and not financial advice. Use your own risk management.