Oversold Reversal for Dip Buyers
Oversold Reversal for Dip Buyers — How to use this Screener
Written By Ehsaan XP
Last updated 3 months ago
Navigation
Getting started with SGM Screener — The screener workflow, UI map, and full glossary.
Green Light Trend Rider — Trend-following candidates with less noise (beginner-friendly default).
Top Gainers & Volume — Momentum breakouts with volume confirmation (fast moves, higher risk).
Overview
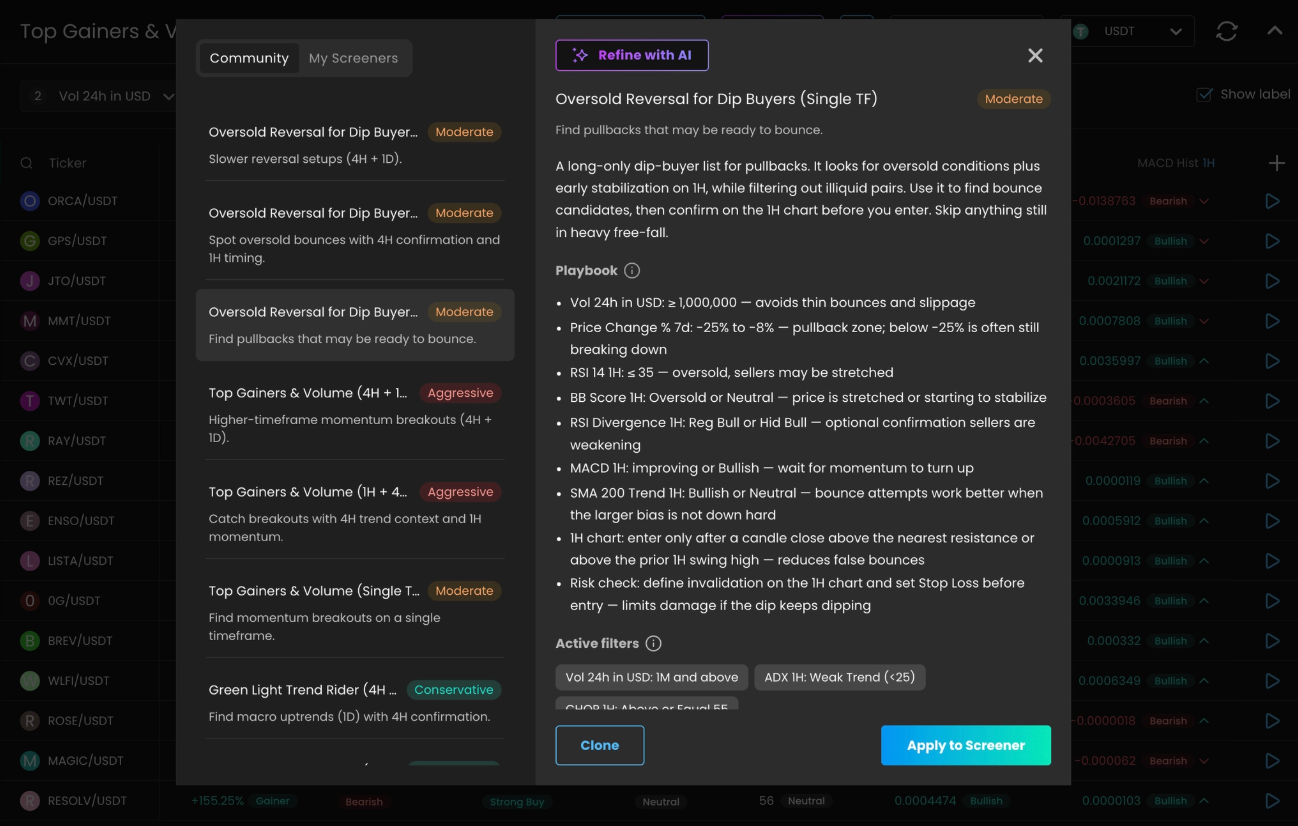
Oversold Reversal for Dip Buyers is a contrarian Screener for bounce attempts after meaningful pullbacks. The goal is not to catch the bottom. The goal is to find oversold conditions that start to stabilize, then enter only after you see confirmation.
This Screener can produce great entries when a reversal sticks, but it can also produce painful drawdowns if you treat “oversold” as a guarantee. The core skill here is risk management: define invalidation, cap your exposure, and set an exit plan so you do not get stuck in a regime change.
Timeframe versions
This Screener is available in multiple timeframe versions. The multi-timeframe versions exist because reversals are easy to fake on one timeframe.
Single TF is the fastest version. It can find early candidates, but you will see more false starts.
1H + 4H uses 4H to confirm oversold and stabilization, then uses 1H for timing. It is usually the best balance if you want reversals but want more confirmation.
4H + 1D uses 1D as a macro filter and 4H for timing. It is slower, but it helps you avoid buying dips inside strong downtrends.
How to pick:
Choose Single TF when you want earlier signals and you are willing to be strict about confirmation.
Choose 1H + 4H when you want reversals with stronger stabilization checks.
Choose 4H + 1D when you want fewer signals and more macro safety.
If you choose a multi-timeframe version, follow its Playbook in Screener details. The logic is the same, but key checks move to 4H or 1D and thresholds can be stricter.
TL;DR
Use this to find pullbacks that may be ready to bounce — not free-falling knives.
Confirmation matters: look for improving momentum + a simple chart trigger.
Beginner default: OMNI (Bullish Omni AI) with recovery-first settings and strict guardrails.
When to use / when to skip
Use this template when a pair has pulled back meaningfully (7d drawdown) and starts to stabilize. It’s best when the broader bias is not strongly bearish and you can clearly define invalidation on the chart.
Skip it (or be extra strict) when price is still in a heavy free-fall, liquidity is thin, or the market regime is “panic selling”. Those are the conditions where oversold can stay oversold for a long time.
Concept
Oversold conditions can lead to bounces, but only after selling pressure weakens. This Screener is built to surface candidates where the stretch is present and early stabilization starts to appear, so you are not buying pure panic.
Think of it as a two-step filter: first you find potential reversal context, then you demand a confirmation trigger before you commit capital.
What to expect
Expect mixed outcomes. Some bounce attempts fail and continue down. Patience matters: the best entries often come after the first stabilization sign, not on the first red candle.
Benefits / risks
Benefits: potentially better entries if a reversal sticks, and clear “I’m wrong” levels around recent swing lows/support zones.
Risks: falling knives, dead-cat bounces, and long underwater periods. Treat risk limits as part of the setup.
Playbook
This is a bounce-hunting checklist. Don’t rush the last steps. A reversal without confirmation is often just a falling knife with a nicer label.
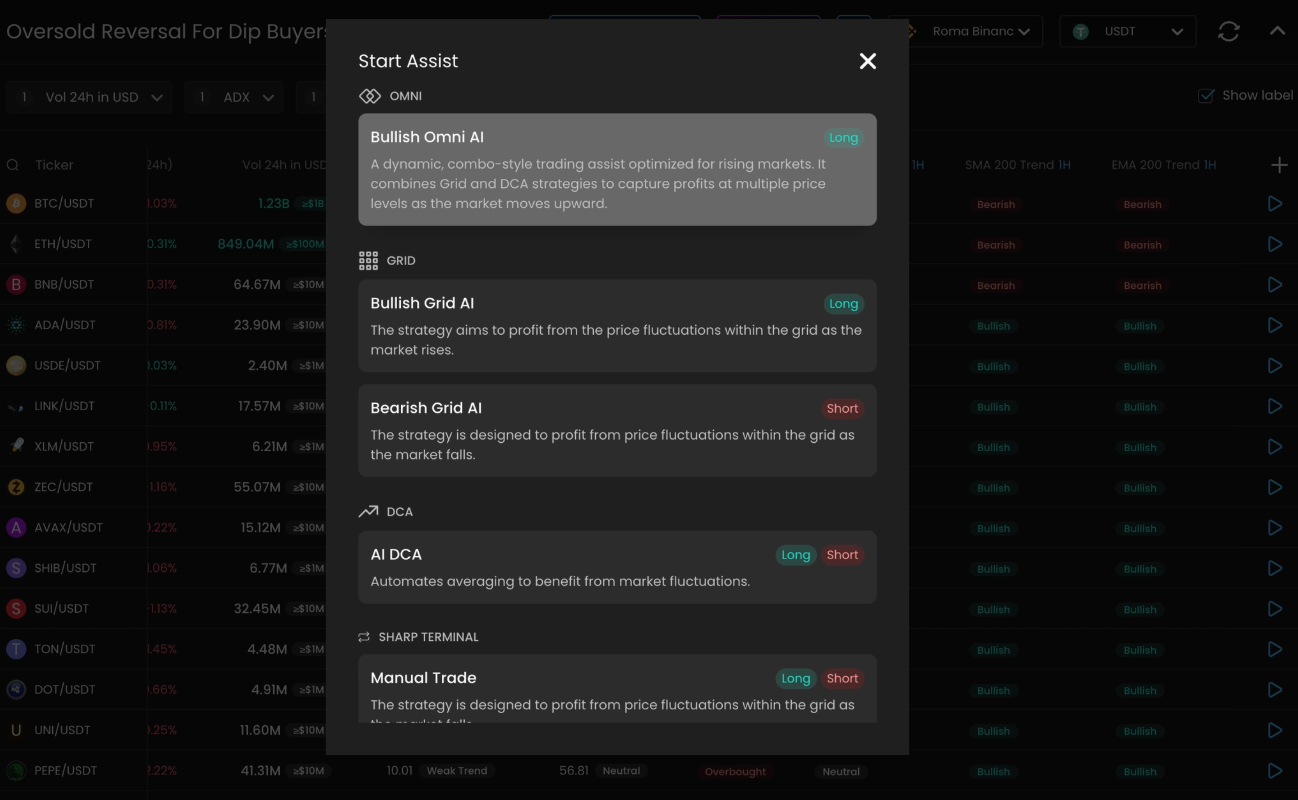
Pick an Assist
Never let an Assist run forever. Markets change regimes. Always define an exit plan. For better results, every Assist should have an explicit exit strategy. For GRID and OMNI, set an upper limit and a downside plan. For Instant DCA, set Take Profit, Stop Loss, and strict caps. This reduces the risk of slow bleed and “hope holding” when the market regime changes.
Recommended OMNI
Reversals can be bumpy. OMNI can “work a recovery” better than a pure grid if you cap risk and don’t assume an instant V-bounce.
Starter setup (from the template tips):
DCA orders = 5
Upper Price Limit = ON
Trailing Up = OFF until the recovery is clear
Must-set guardrails:
Set a strict max orders cap
Set a Take Profit plan and consider a review timebox or Deal Timeout so the Assist does not run forever.
Alternative GRID
GRID using Bullish Grid AI can fit after stabilization, when price starts ranging and giving repeatable bounces. Start only after momentum improves and you can define a realistic range. Pick a downside plan before you start: Lower Stop Price as a hard exit, or Price Protection if you accept deeper pullbacks.
Alternative Instant DCA
Instant DCA fits when you want a strict, capped averaging plan for a bounce attempt.
Starter notes (from the template tips):
Base order = 10% of planned deal budget; extra order amount = base order.
Max extra orders 7; volume step 1.15.
Deviation ≈ ATR % 1H; deviation step 1.10.
Must-set guardrails:
Set Take Profit before starting. Bounce attempts often give quick relief rallies, and without a TP plan it is easy to round-trip.
Set a clear final Stop Loss and keep sizing within your budget.
Step-by-step example
The steps below include screenshot placeholders you can replace later.
This example assumes Single TF for simplicity. If you selected a multi-timeframe version, keep the same flow but follow its Playbook checks and use the correct timing timeframe for the chart trigger.
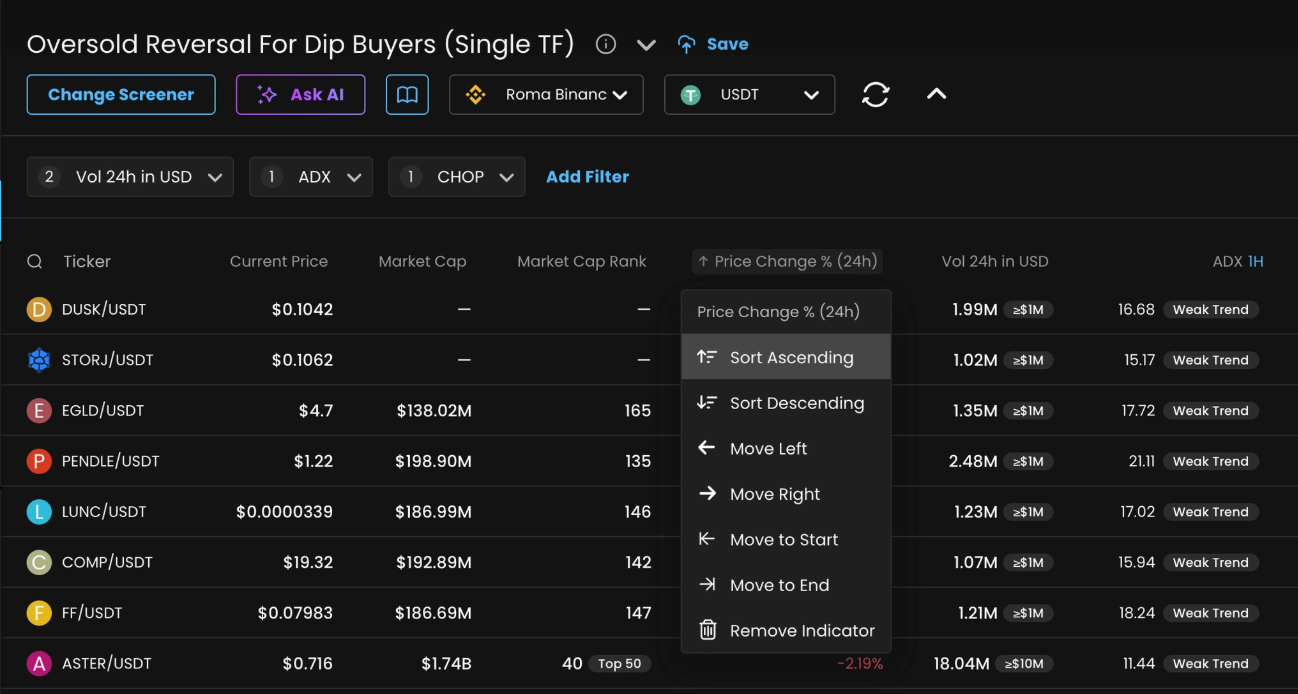
Select the template.
Find controlled pullbacks (not the worst collapses).
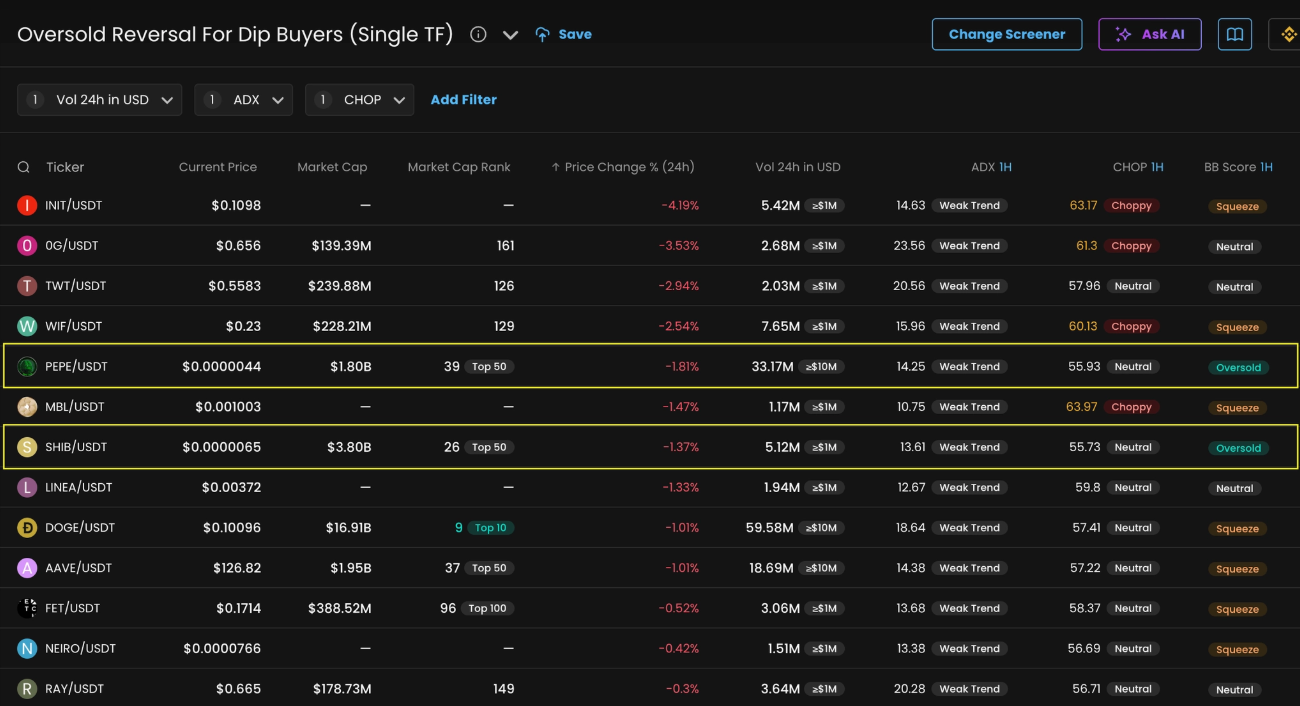
Confirm oversold + stretch signals.
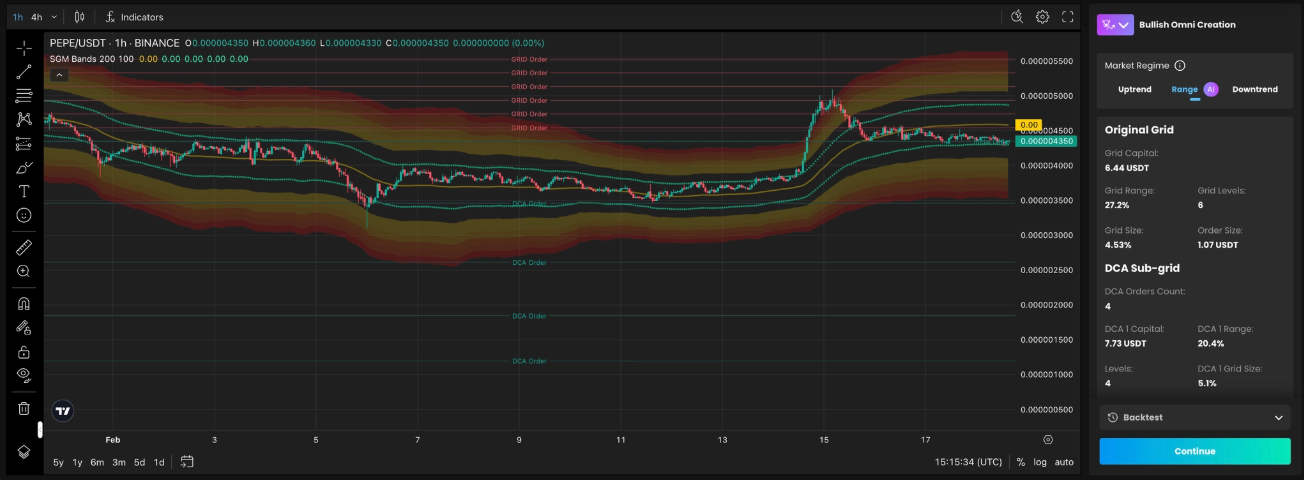
choose PEPE/USDT or SHIB/USDT as they have BB Score =
Oversoldand they are most liquid pairs by volume and market capitalizationalternatively you can choose DOGE/USDT, after confirming uptrend exit from squeeze event
Start an Assist with recovery-first settings.
Set proper settings to the Assist
Keep AI Settings, Short Term for Single TF or 1h + 4h Screeners, Long Term for 4h + 1D
Choose Market Regime between
RangeorDowntrend, based on SGM Consensus and SMA 200 Trend indicators confluencealternatively copy settings to manual and enter recommended settings above:
set DCA Orders Count = 5
Step Scale = 1.3, Volume Scale = 1.3
Don’t forget to set Upper Limit Price to top of SGM Bands indicator
and Timeout Hours to 168 (7 days) for Short Term or 672 (28 days) for Long Term
Reminder: This guide is educational and not financial advice. Use your own risk management.