Getting started with SGM Screener
SGM Screener helps you shortlist crypto pairs that match a strategy right now. It’s best used as a fast workflow: shortlist in the table → confirm on a chart → start an Assist with a clear risk plan.
Written By Ehsaan XP
Last updated 3 months ago
Navigation
Green Light Trend Rider — Trend-following candidates with less noise (best “default” for beginners).
Top Gainers & Volume — Momentum breakouts with volume confirmation (fast moves, higher risk).
Oversold Reversal for Dip Buyers — Pullbacks that may be ready to bounce (needs confirmation and patience).
What the Screener is and isn’t
The screener is a shortlisting tool. It helps you narrow “too many coins” down to a few candidates that match a template’s logic.
It is not a guaranteed buy/sell signal. Always do a chart check (levels + invalidation) before you start an Assist.
The 60‑second loop
Choose a screener template (your strategy lens).
Scan the table for “mostly matching” rows.
Open Screener info (ⓘ) and follow the Playbook to validate your best rows fast.
Chart check your top 1–3 candidates (structure + trigger + invalidation).
Start an Assist on the one you actually want to trade.
Which template should I use today?
Green Light Trend Rider is your “safer continuation” option. It’s built to follow bullish trends and avoid choppy conditions that cause whipsaws.
Top Gainers & Volume is for active markets when you want to follow strength only if volume confirms it. It can work well — but chasing is the #1 trap.
Oversold Reversal for Dip Buyers is for bounce attempts after meaningful pullbacks. The edge comes from waiting for stabilization and confirmation, not from guessing the bottom.
Timeframe versions
Each Screener is available in a few timeframe versions. The core idea stays the same, but the “context” and the “timing” checks move to different timeframes.
How to pick:
If you’re new, start with Single TF or 1H + 4H so you learn quickly without drowning in noise.
If you can’t watch charts often, prefer 4H + 1D.
If markets feel messy and whippy, move up a version and let the higher timeframe filter more noise.
The in-app Playbook in Screener details is the source of truth for the specific version you selected. Use this guide to understand the workflow, then follow the Playbook for the exact checks and thresholds.
Beginner guardrails
Liquidity first. Thin pairs wick and slip more.
Don’t chase extremes. Late entries usually have worse risk/reward.
Always define invalidation. Know what price action proves you’re wrong before you click Start.
Change one thing at a time. If you tweak filters/indicators, do it slowly so you learn what actually helped.
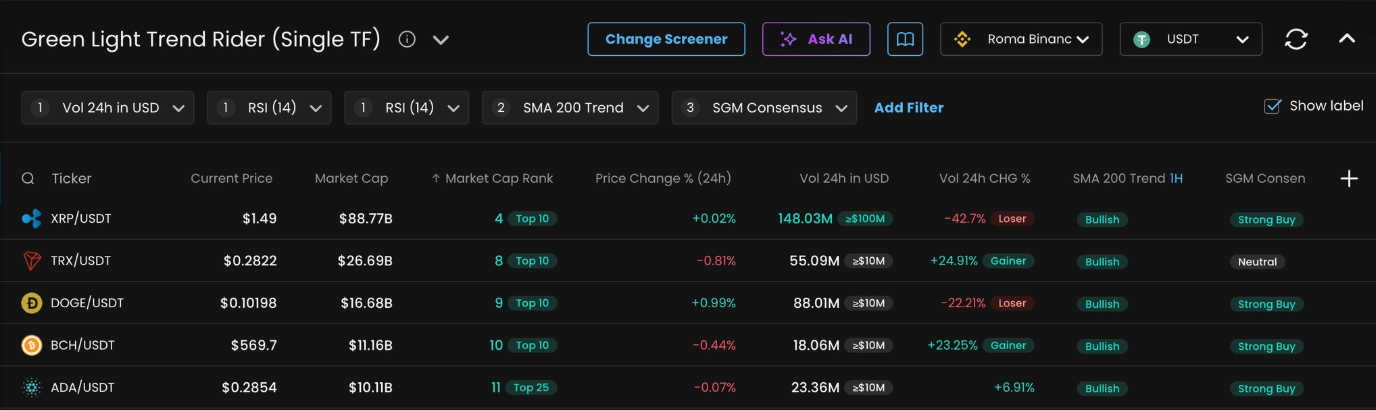
What’s on the screen
Change Screener: pick a template (Community) or one you saved (My).
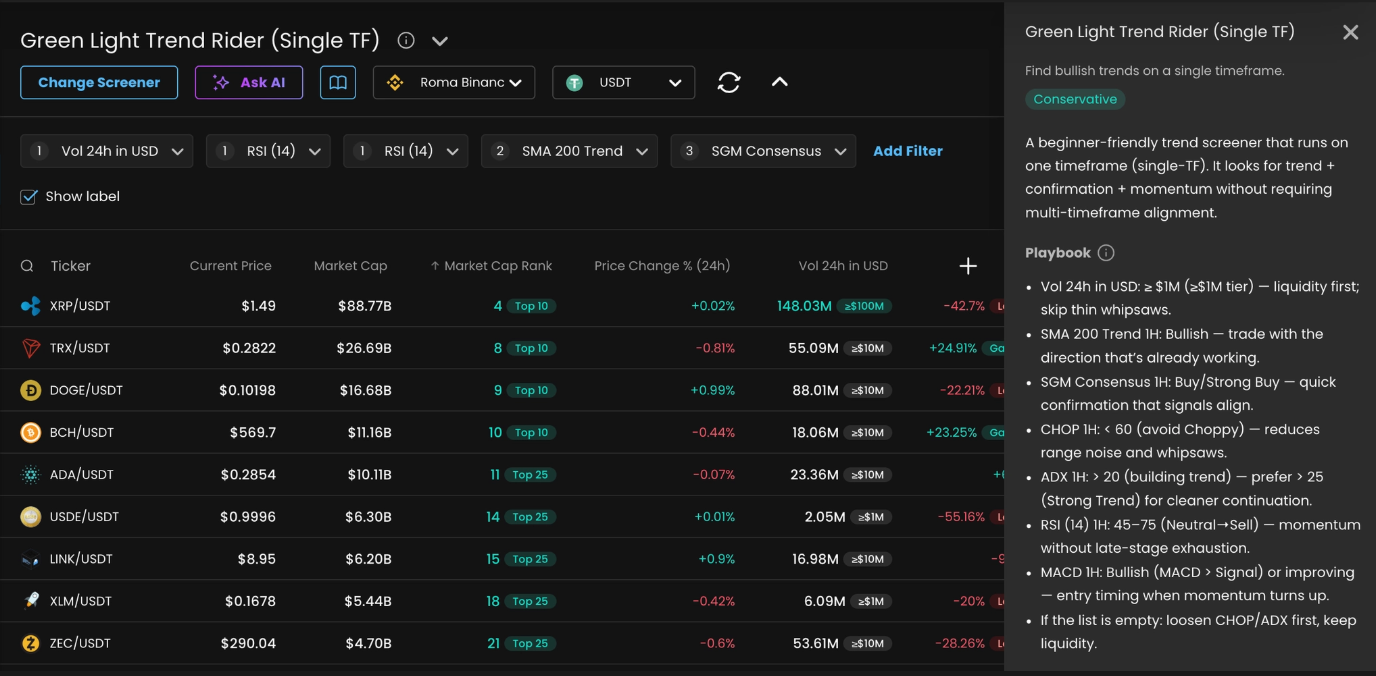
Screener info (ⓘ): opens Screener details with the goal + Playbook checklist.
User guide / Take tour: quick help if you’re new.
Exchange: choose where you trade (liquidity and behavior can differ by exchange).
Refresh: manually update the view (it also auto-updates every minute).
Labels toggle: shows quick “category pills” next to values (faster scanning).
Columns menu: choose which indicators you want visible in the table.
Filters row: the active rules for the current screener (what gets included/excluded).
Results table: each row is a pair; each indicator is shown as a column (hover cells for explanations).
Key concepts
Template: the strategy lens you pick (trend / breakout / reversal). A template usually comes with recommended indicators, filters, and a Playbook.
Filters: rules that narrow the list. Tighten = fewer results; relax = more ideas.
Indicators: the signals you show in the table (trend, momentum, volume, volatility, sentiment, etc.). Fewer indicators = faster decisions.
Labels: quick categories next to values (e.g., Bullish/Choppy/Strong Buy). Great for scanning — still confirm with tooltips.
Timeframes:
1H / 4H / 1Dare indicator timeframes.24h / 7dare rolling windows (price/volume stats over the last 24 hours / 7 days).
Playbook: the checklist in Screener details that tells you which indicators to check, the target, and why it matters. Read it top-to-bottom: context first, timing last.
Your first shortlist
Let’s do a simple trend shortlist (a good first-day exercise).
Start by turning Labels on and sorting by Vol 24h in USD so you’re looking at tradeable markets first.
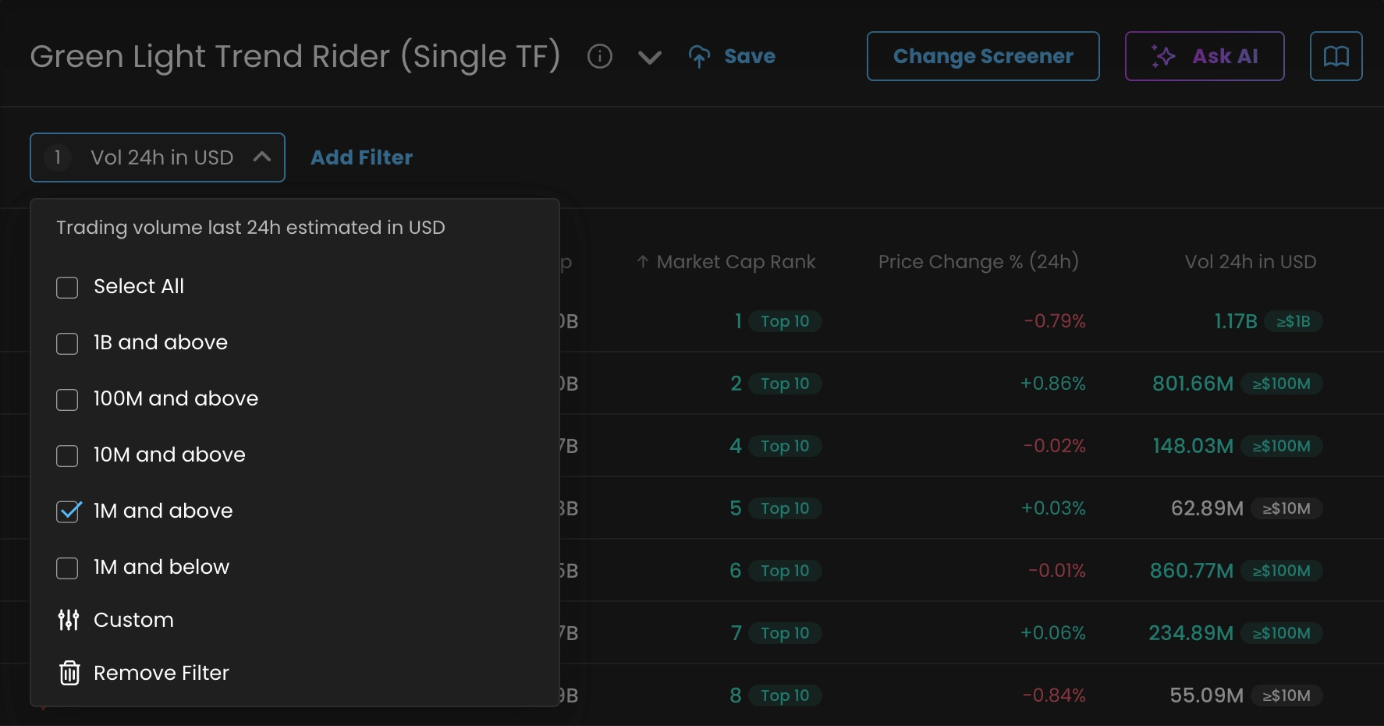
As a quick liquidity rule of thumb:
Good minimum (most users):
Vol 24h in USD ≥ $1MCleaner fills:
≥ $10MVery liquid / large caps:
≥ $100M
Then validate your best rows with the Playbook. The goal is a “clean story”, not a perfect row: trend direction → regime (avoid chop) → confirmation → timing → your risk plan.
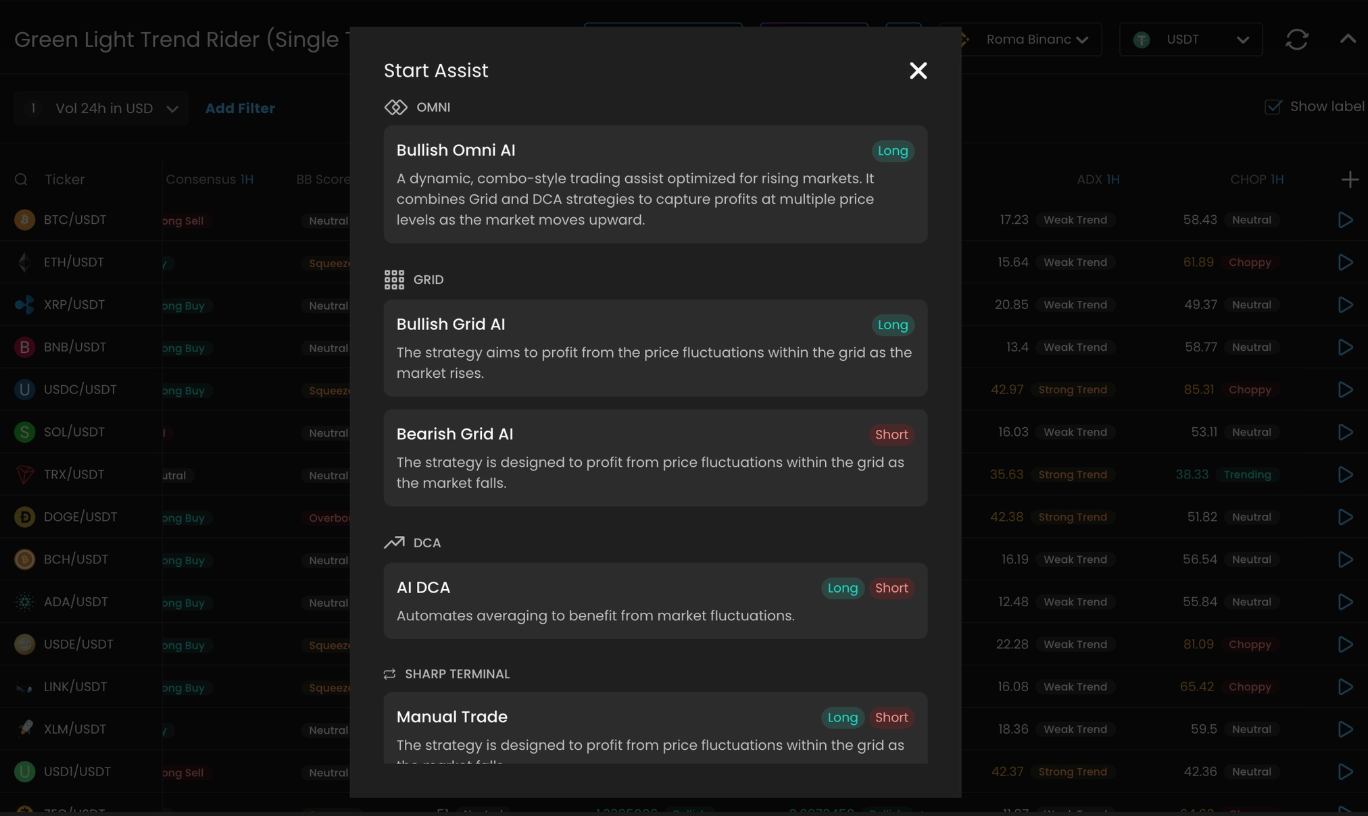
When a row looks clean, do a fast 1H chart check (levels + invalidation), then click the Start Assist (play) button in the table.
Assists
An Assist is an automated execution approach (OMNI / GRID / DCA). Which one is “best” depends on the template and the chart context.
Here are simple mental models:
GRID: works a price range by placing buy/sell orders at multiple levels. Best when price oscillates inside a range.
OMNI: a hybrid that combines grid + DCA behavior. It can handle normal pullbacks better than a pure grid in many conditions, but it still needs clear guardrails.
DCA: enters with a base order and adds “extra orders” as price moves against you to improve average entry. Powerful, but risk grows if price keeps dropping.
Beginner guardrails (for any Assist):
Set a clear Stop Loss / invalidation level first.
Keep a max orders cap and size within your budget.
Prefer consistency across multiple indicators over one “perfect” signal.
How to read a row
If you’re new, it’s easy to stare at 8 indicators and freeze. Use this order:
Liquidity (is it tradeable for your size?)
Direction (is the bias supportive?)
Confirmation (do key indicators agree?)
Timing (is it early/okay, or late/exhausted?)
Risk (where is invalidation, and does the Assist setup respect it?)
Saving a screener
Use the header actions menu (▾) to Save, Save as…, or New. Saving is useful when you’ve made changes you want to keep as a personal screener.
Tips
If you get 0 results, loosen one guardrail at a time (CHOP/ADX first, keep liquidity).
Use Labels to scan, then hover cells for the tooltip before you decide.
The screener is for shortlisting; the chart is for decisions.
Screener Glossary
Indicators
Timeframe-based indicators appear as 1H / 4H / 1D versions in the Columns menu.
Where to go next
Green Light Trend Rider — Trend-following candidates with less noise (best “default” for beginners).
Top Gainers & Volume — Momentum breakouts with volume confirmation (fast moves, higher risk).
Oversold Reversal for Dip Buyers — Pullbacks that may be ready to bounce (needs confirmation and patience).
Reminder: This guide is educational and not financial advice. Use your own risk management.